Charts that adapt as you zoom
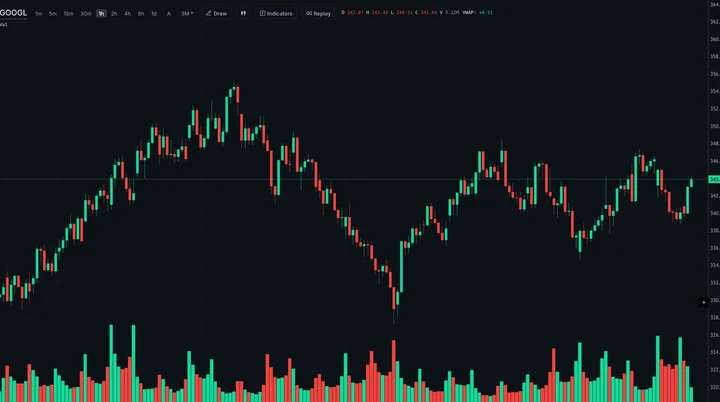
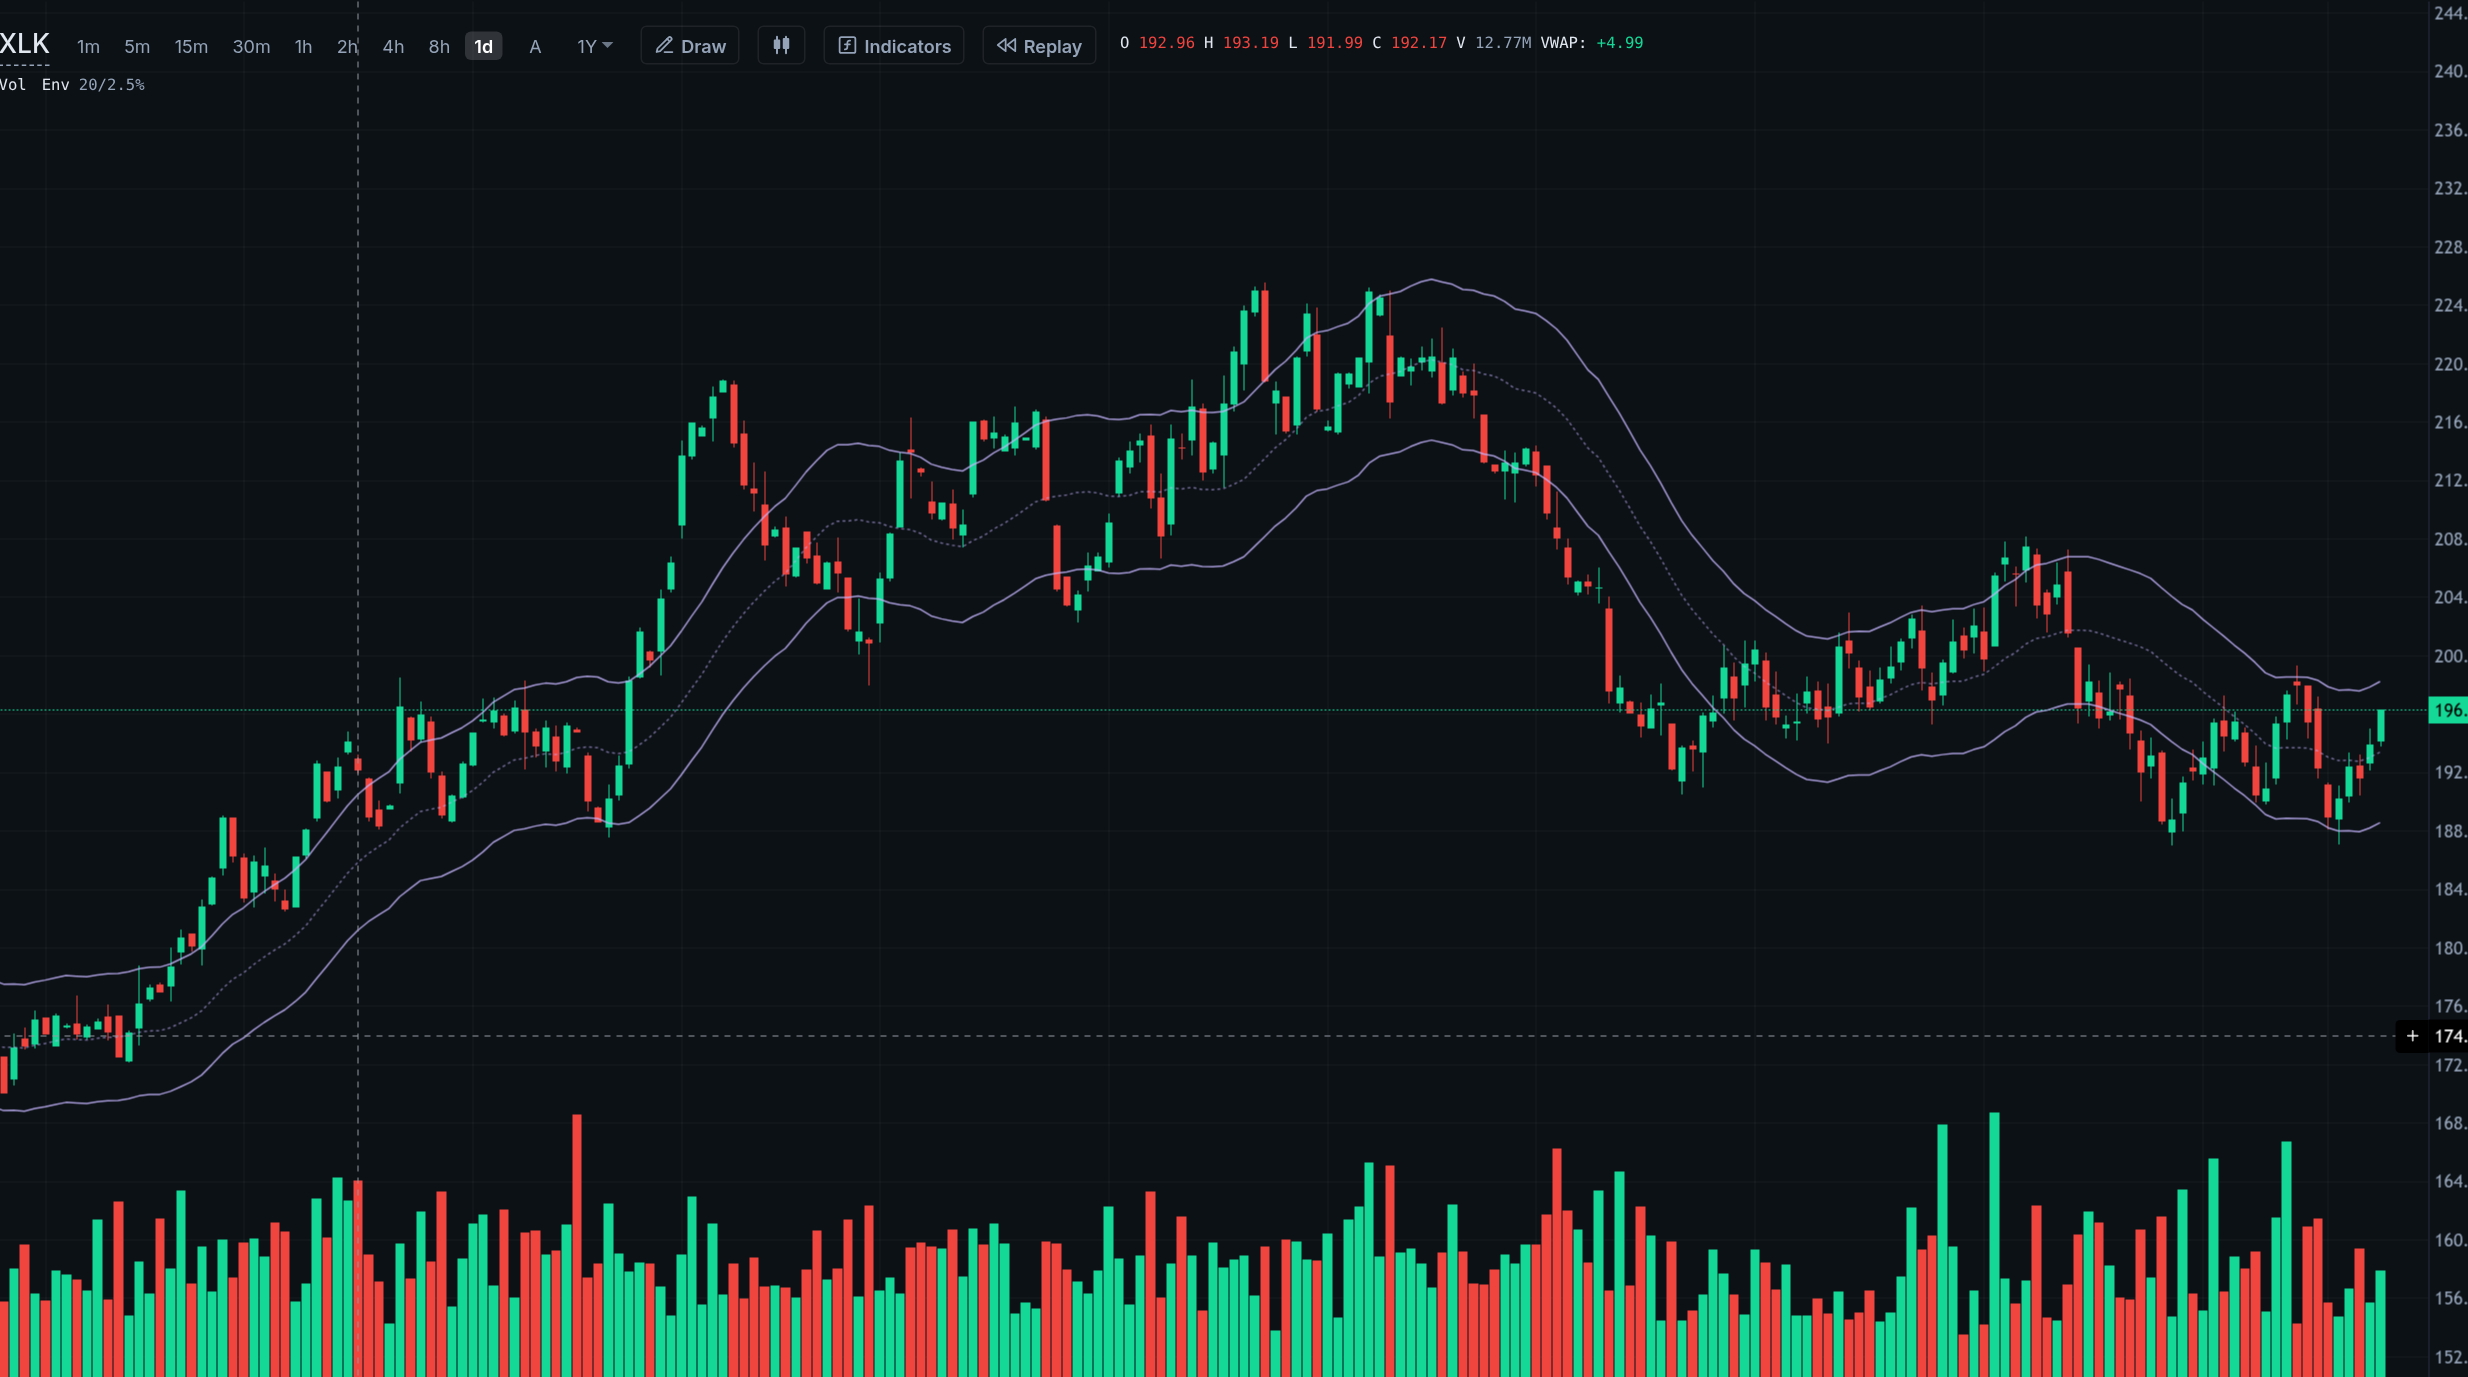
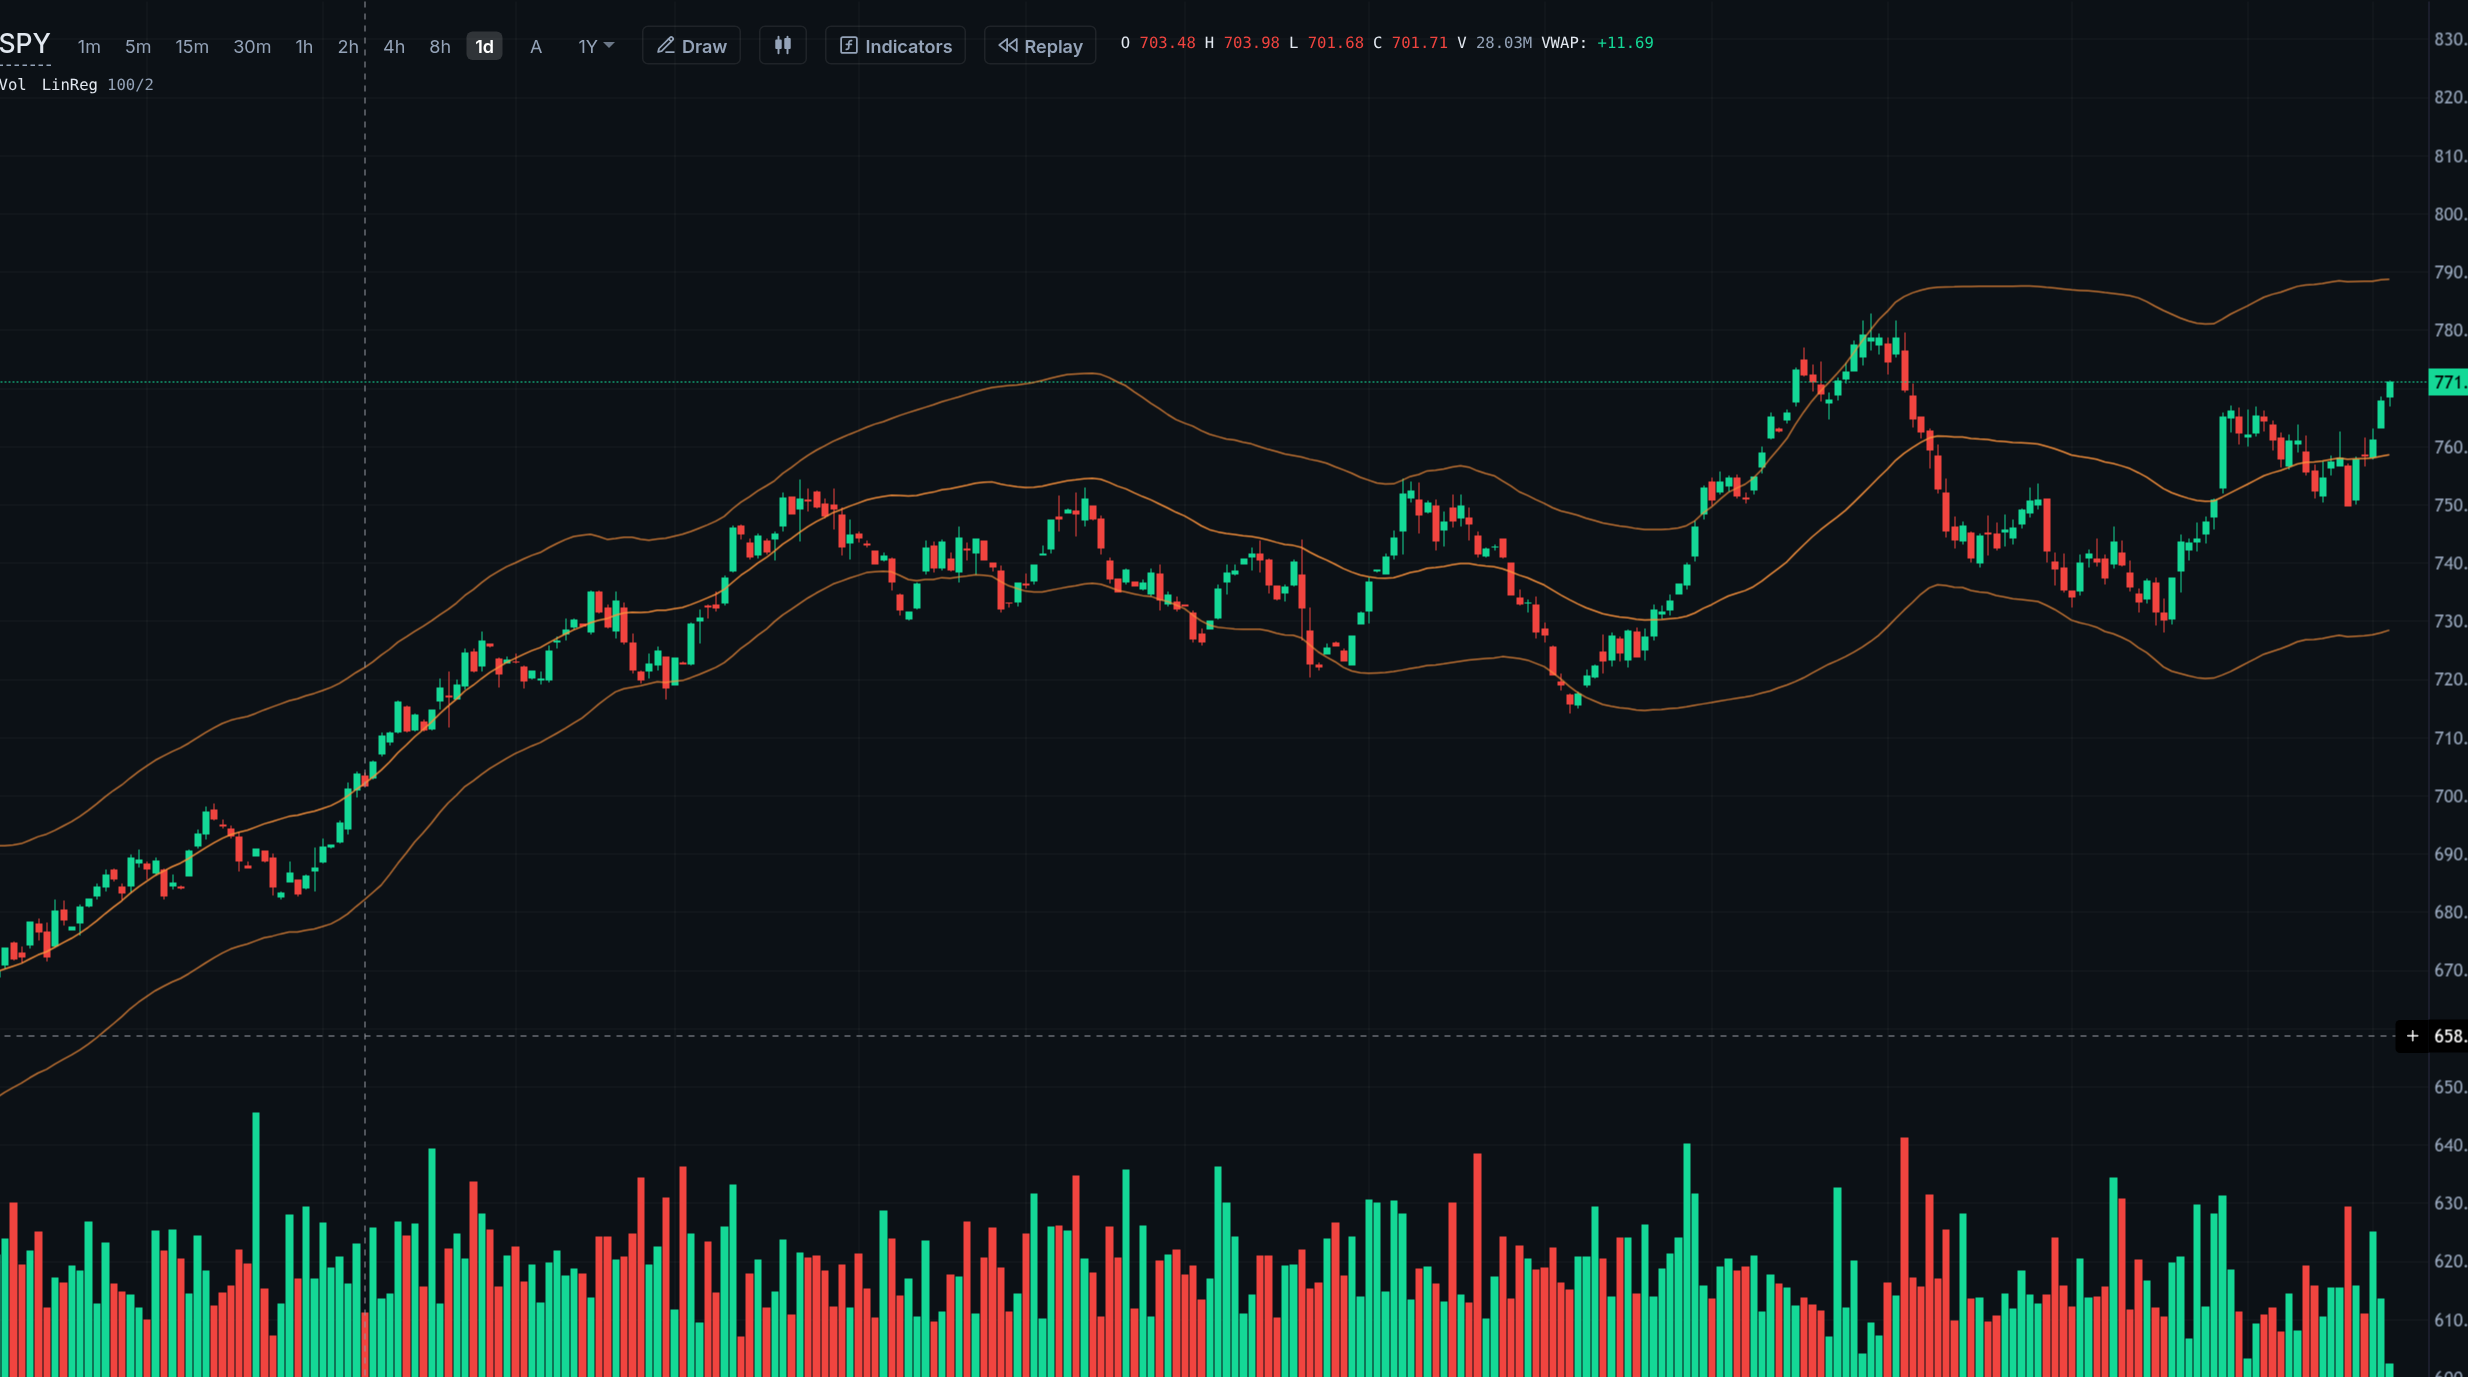
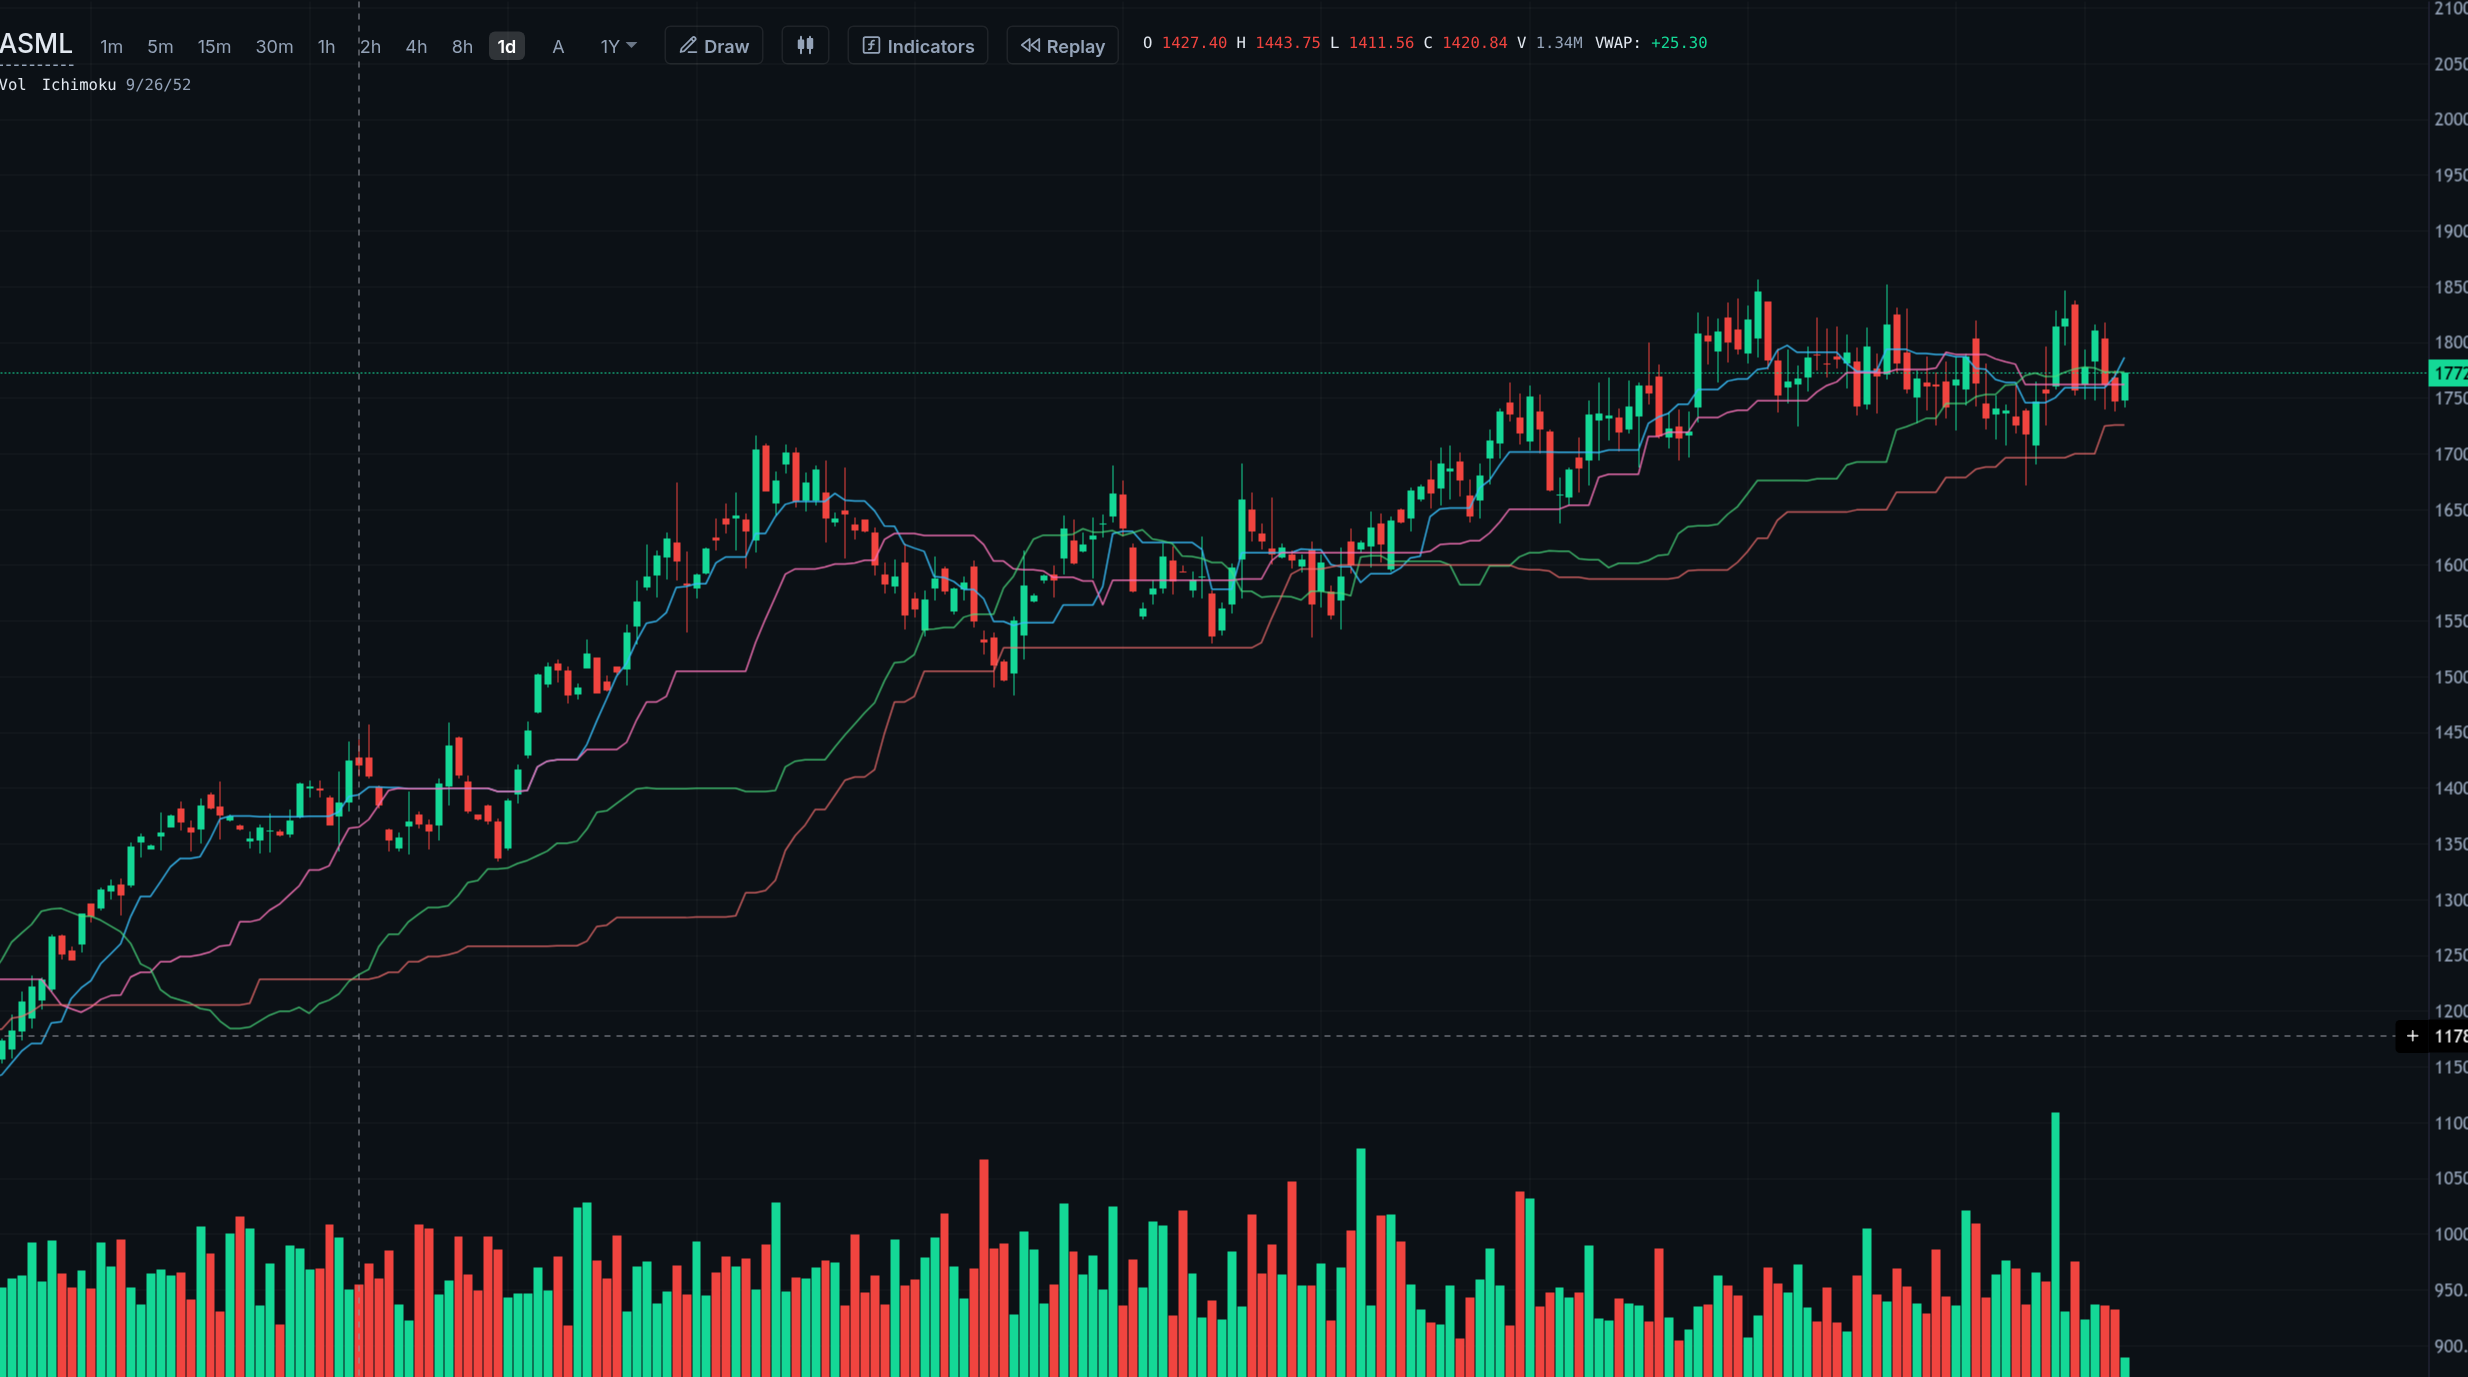
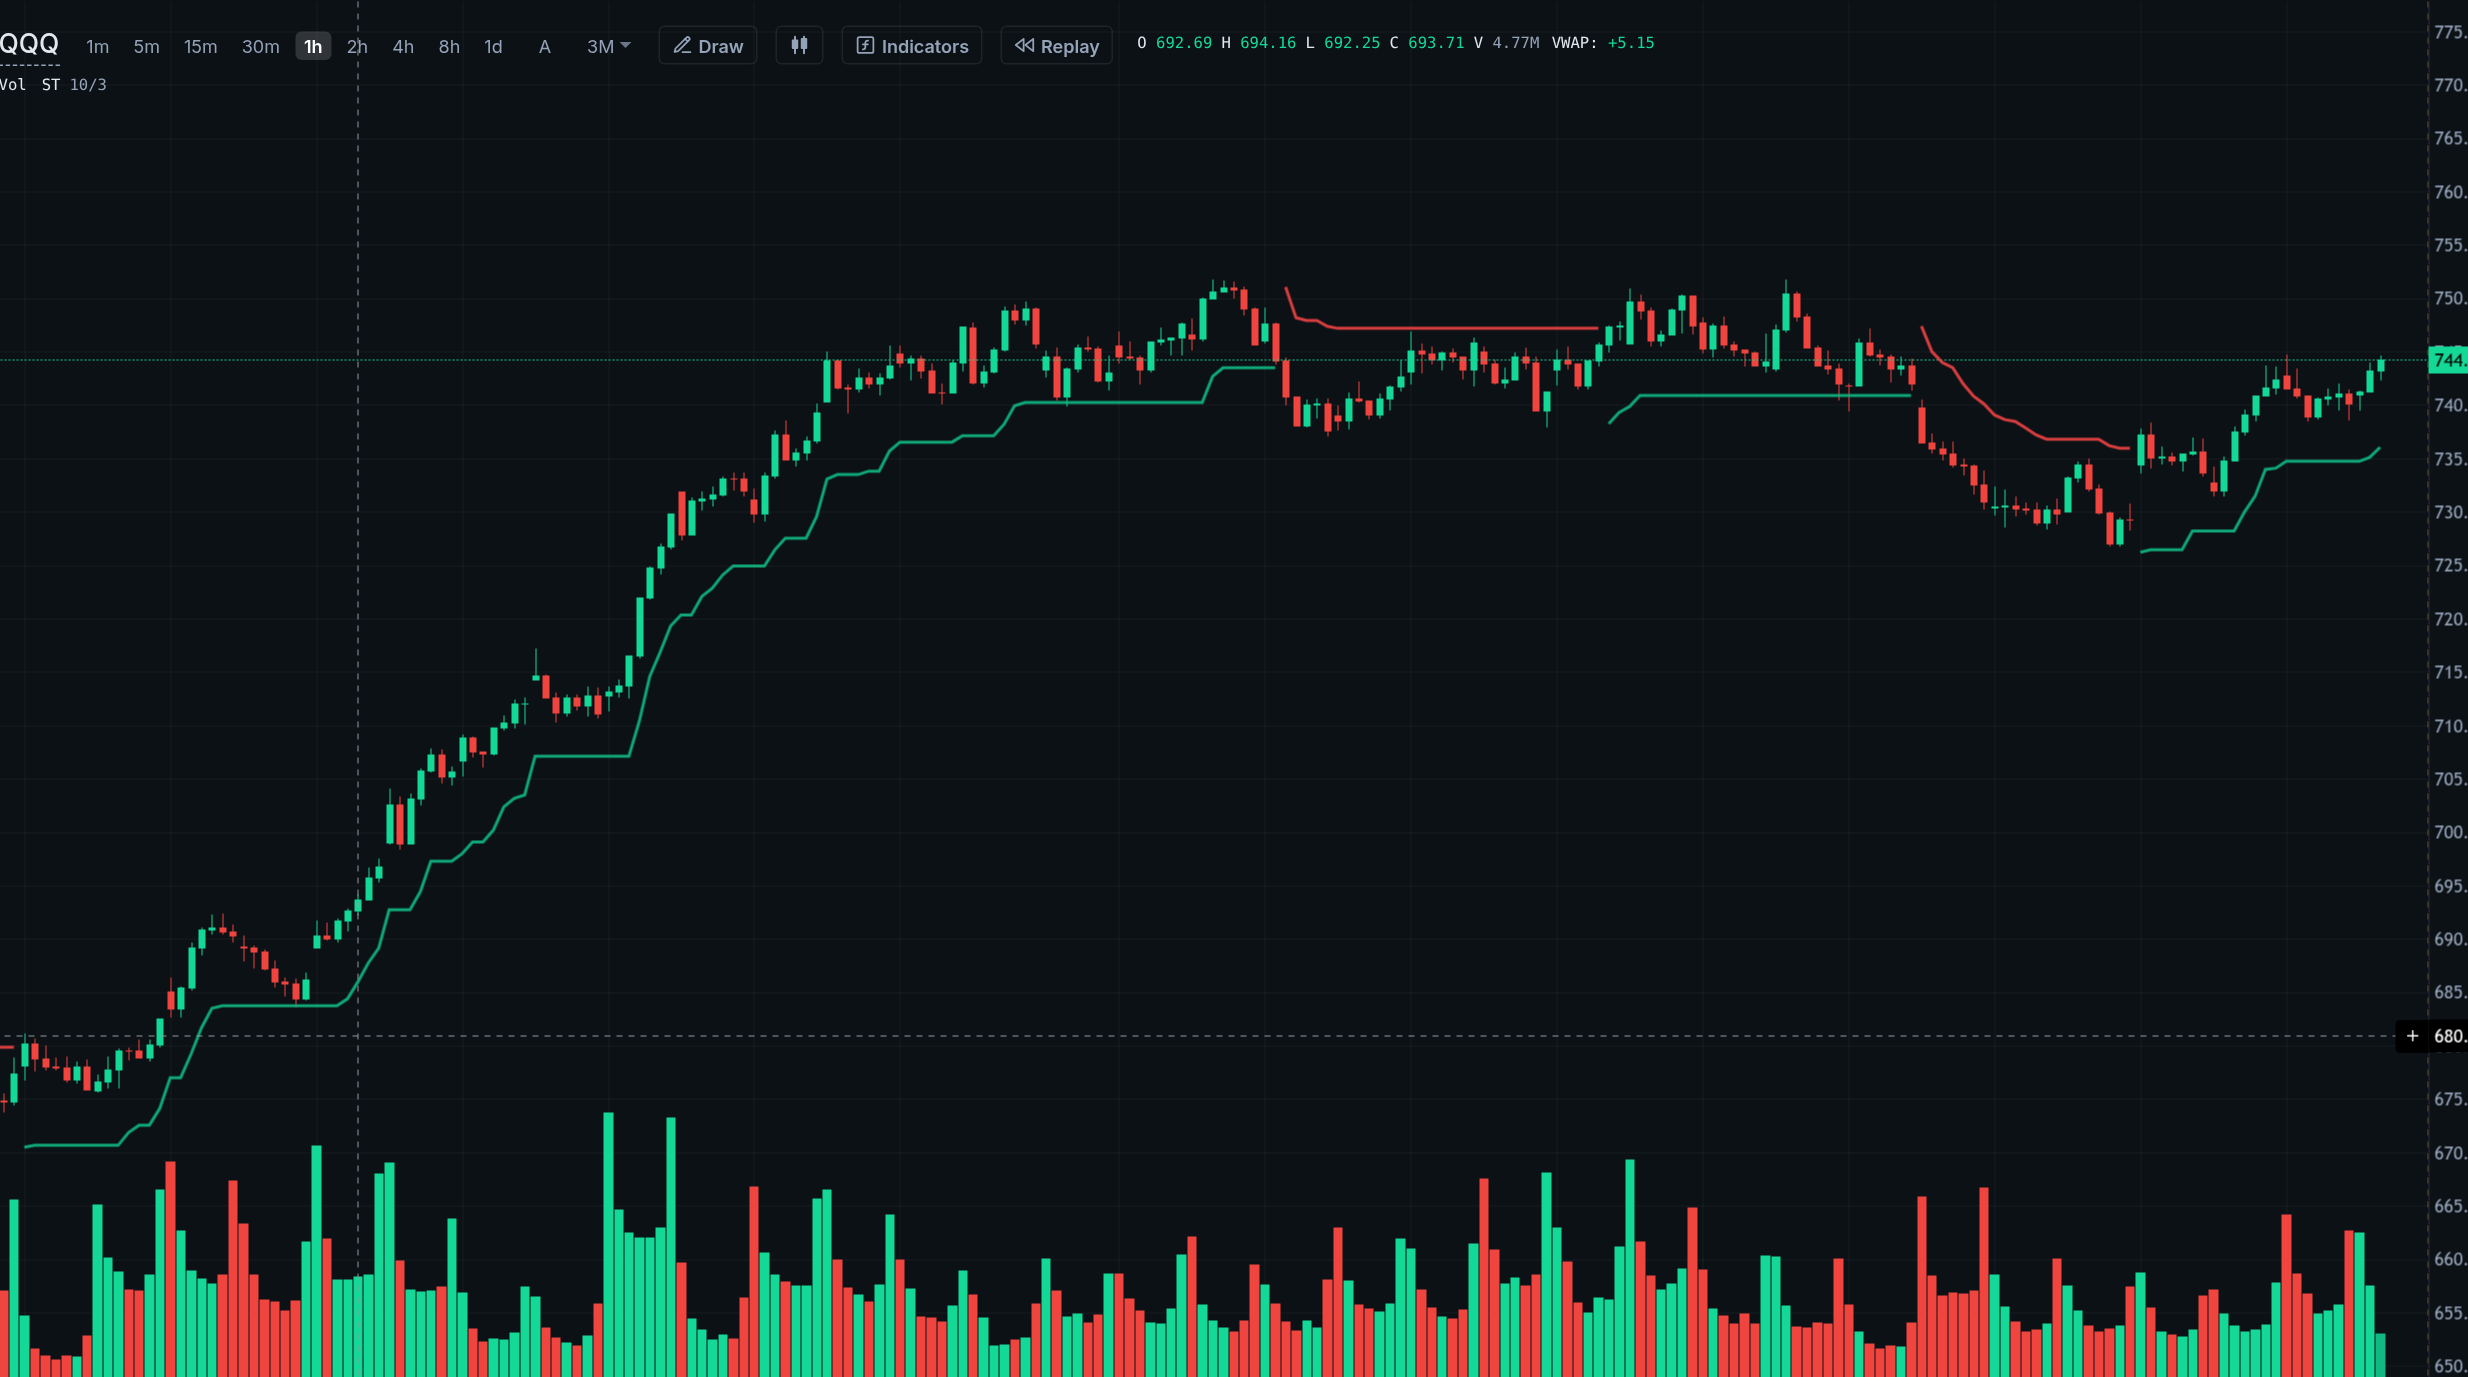
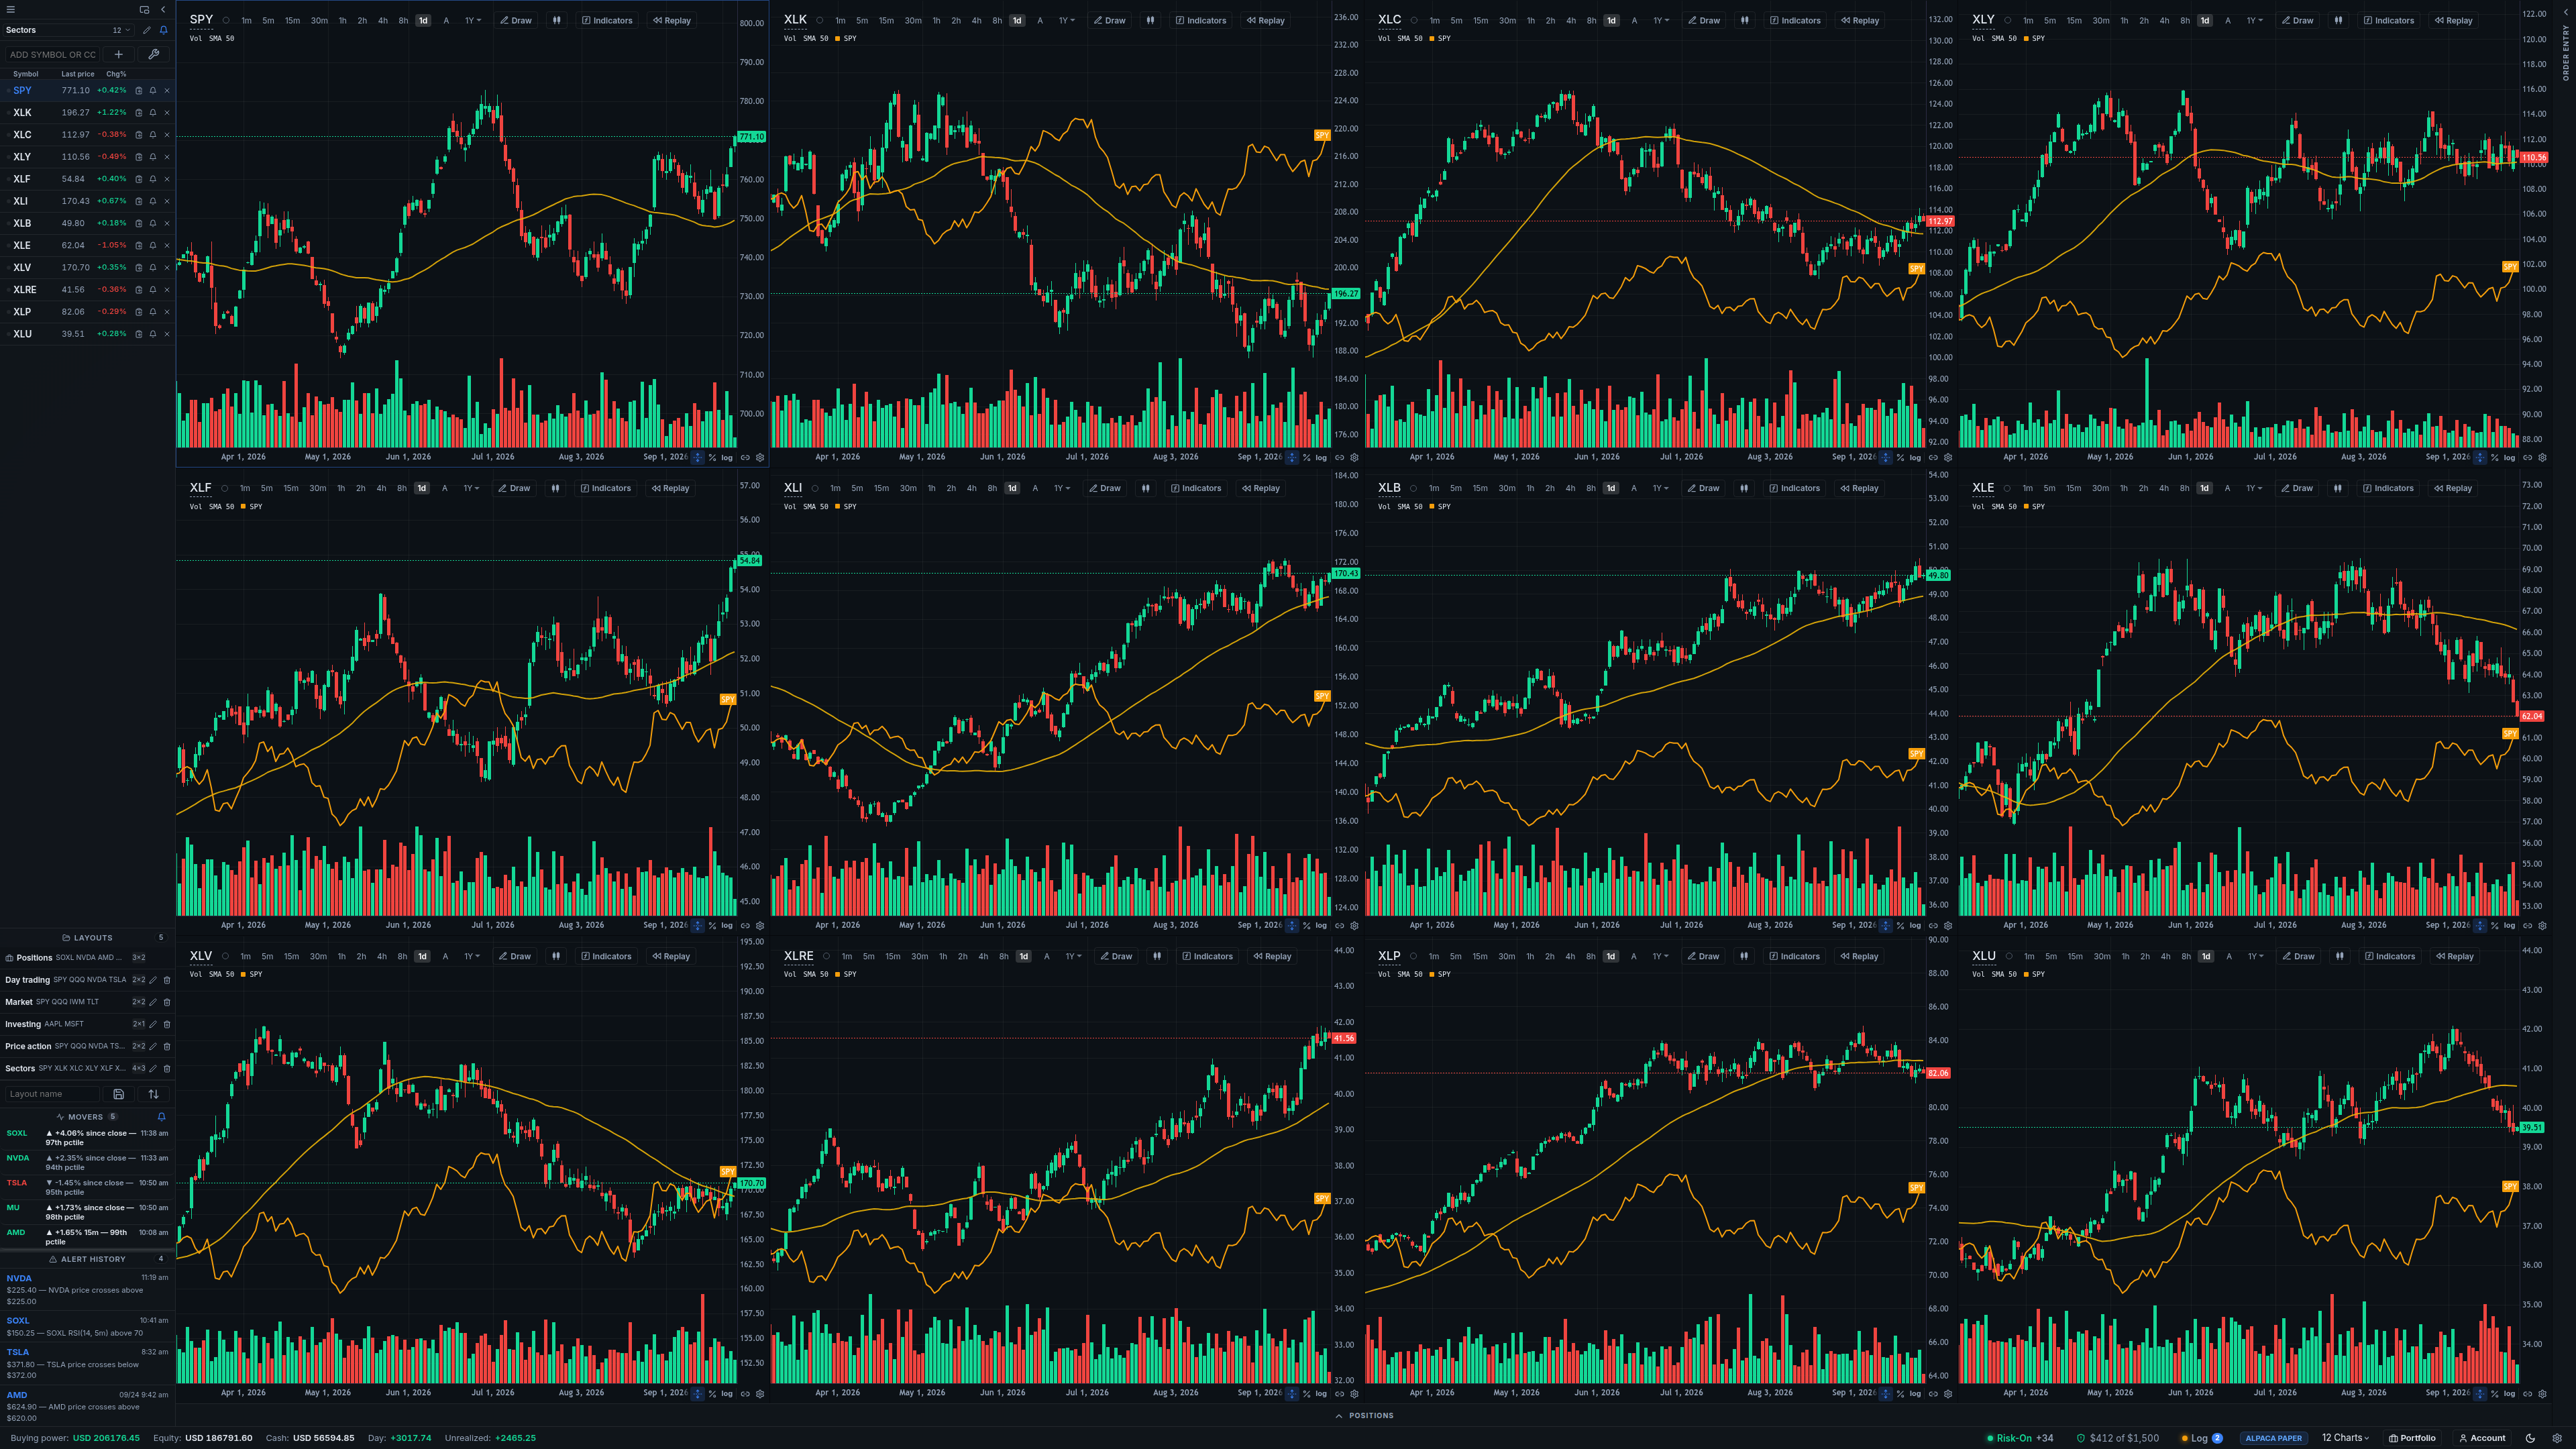
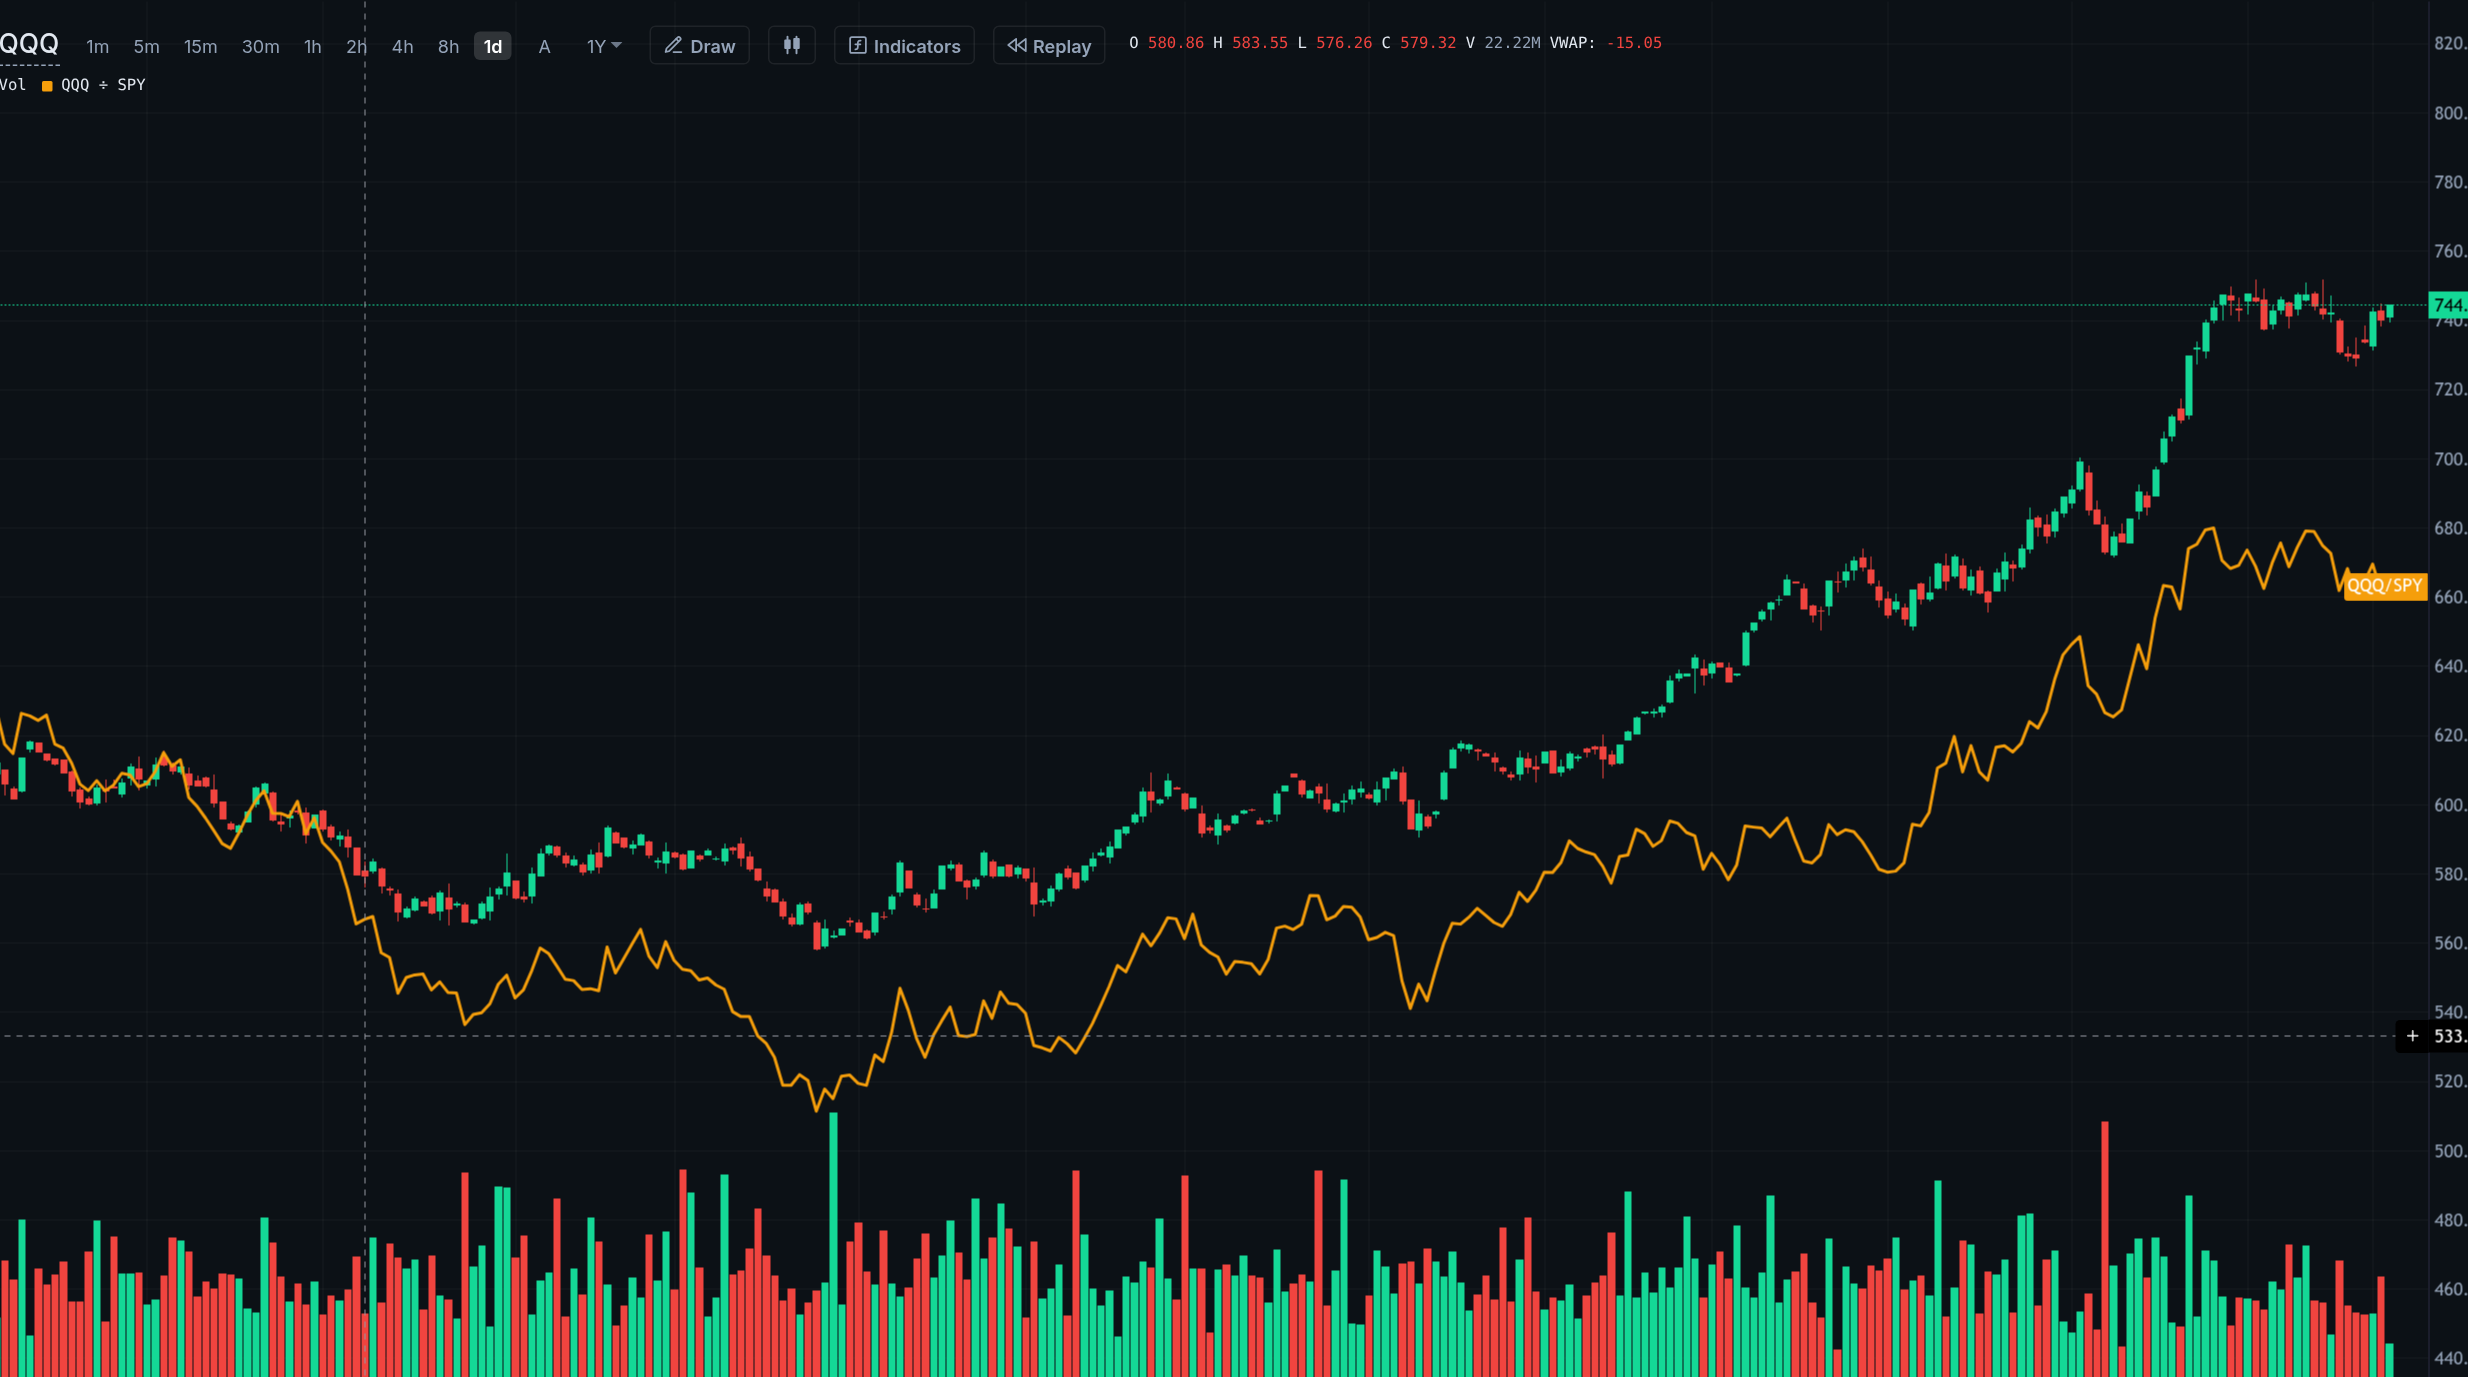
Chart types from candles to point and figure, indicators from VWAP to company figures, automatic detection of zones and trendlines, and drawing tools. Choose a name beside or under each screenshot to switch examples. Set chart types and indicators separately for each chart in a grid.
From ten years to ten minutes, in one zoom
Turn on automatic intervals and candle sizes change as you zoom. Pull back, and minute candles become five-minute, hourly, daily and weekly ones; lean in, and they come back. You do not need to choose a timeframe while you explore.
- The whole history, at every candle size. Zoom into any past session and the chart loads minute candles for that session.
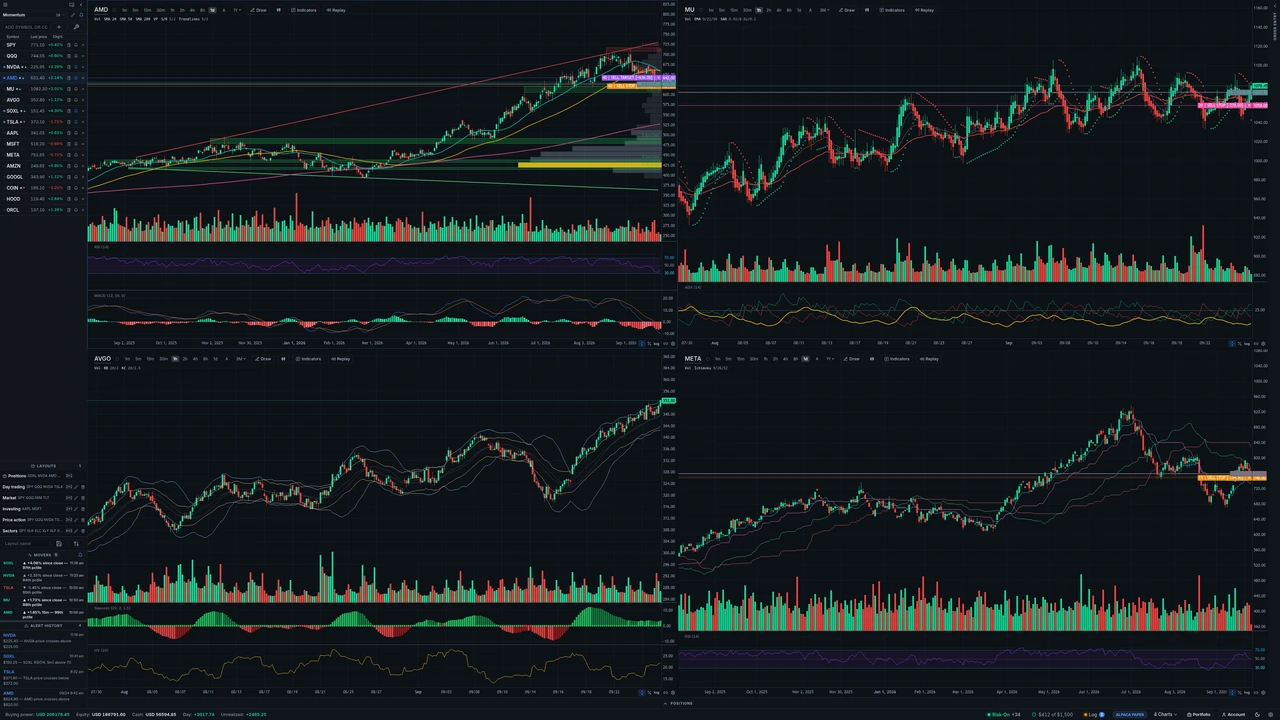
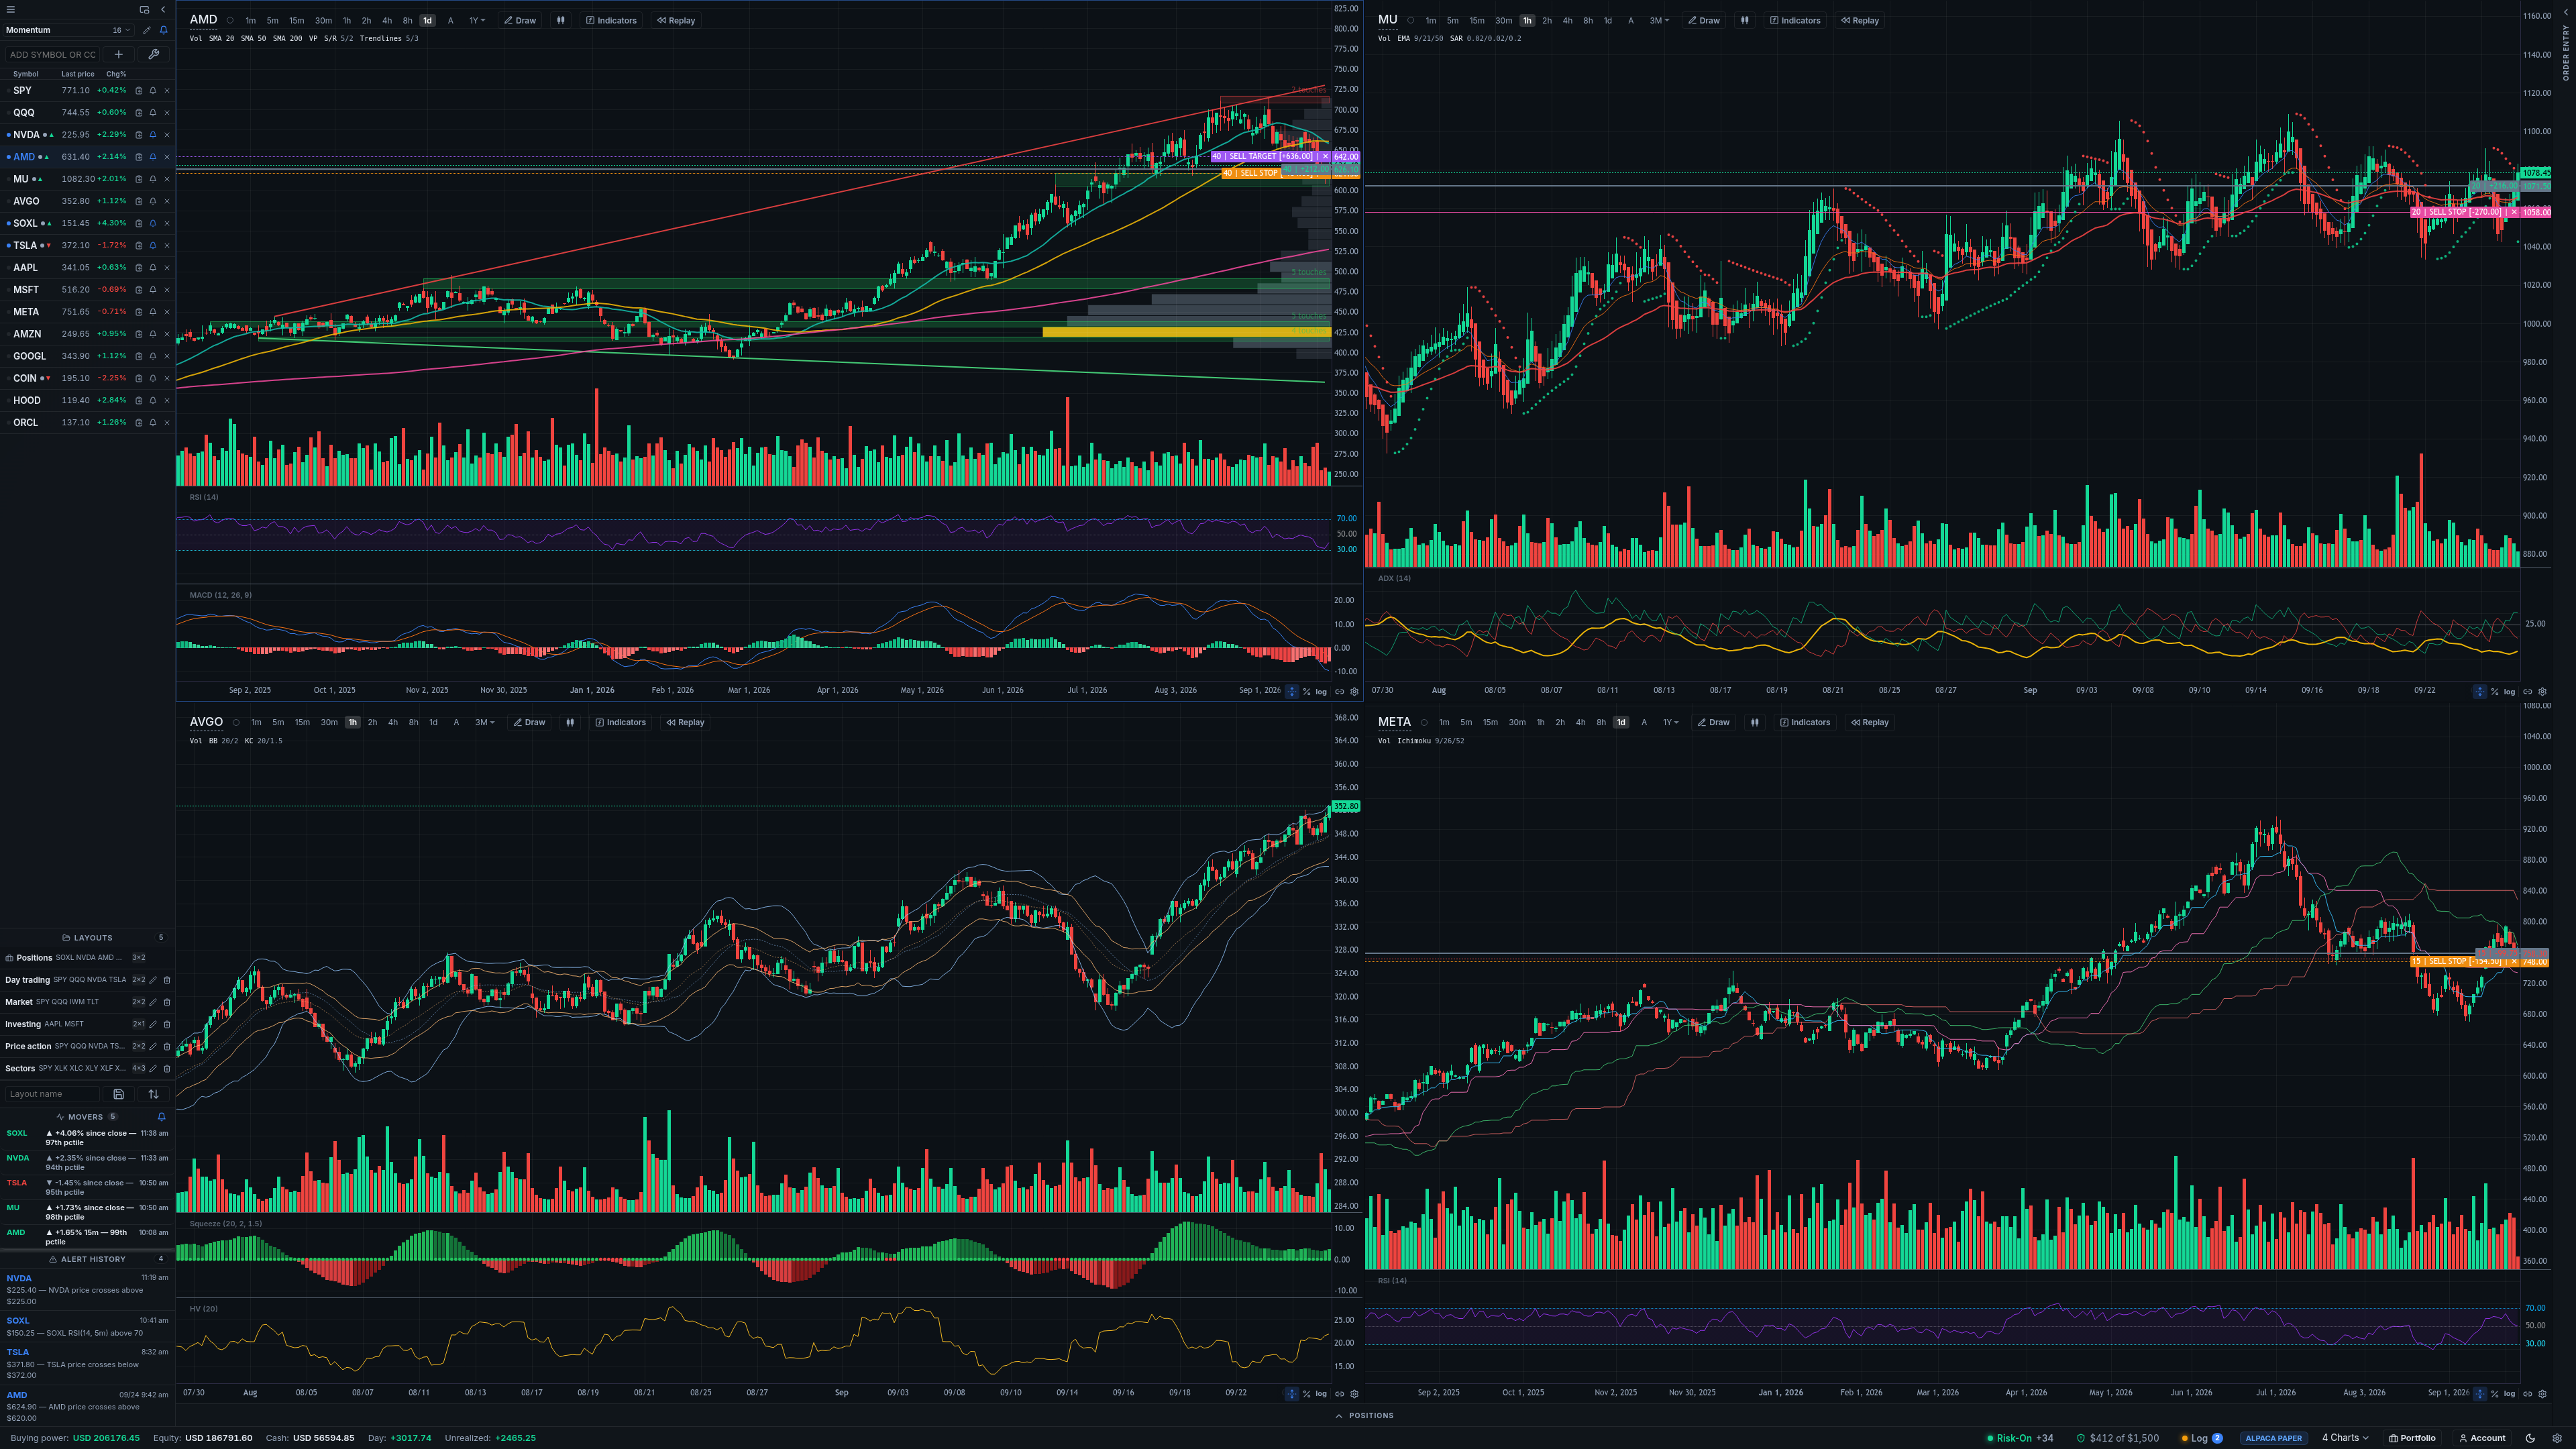
- Synced charts. Sync charts to scroll, zoom and change candle intervals together.
- Drawings that stay put. A line drawn on the hourly chart sits on the same prices on the daily and the one-minute.
Chart types
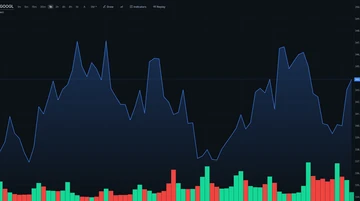
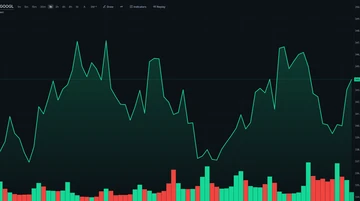
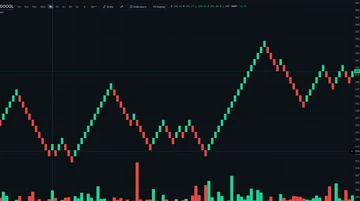
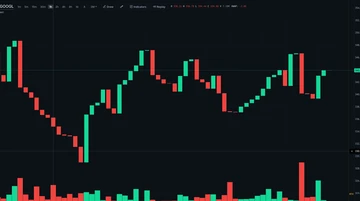
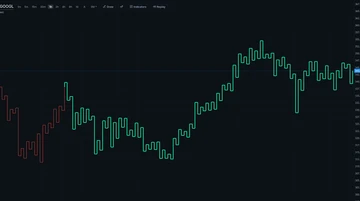
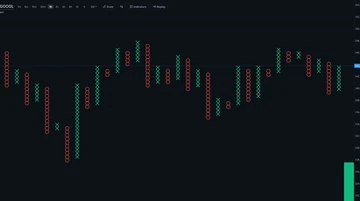
Candles to point and figure, chosen chart by chart from the Chart button beside Indicators. Price-based chart types—Renko, line break, Kagi and point and figure—do not use time, so session lines and time-based indicators are not shown. Select a chart type to enlarge it.
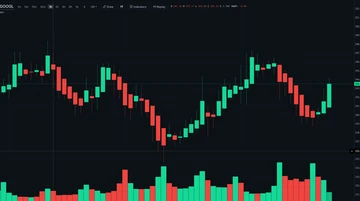
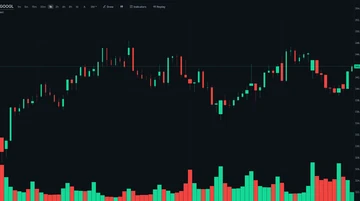
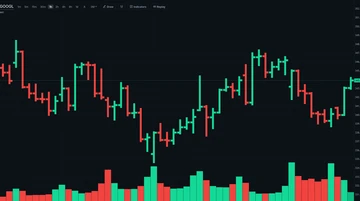
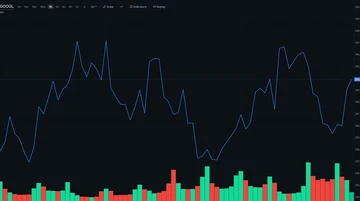
VWAP, levels and volume profiles
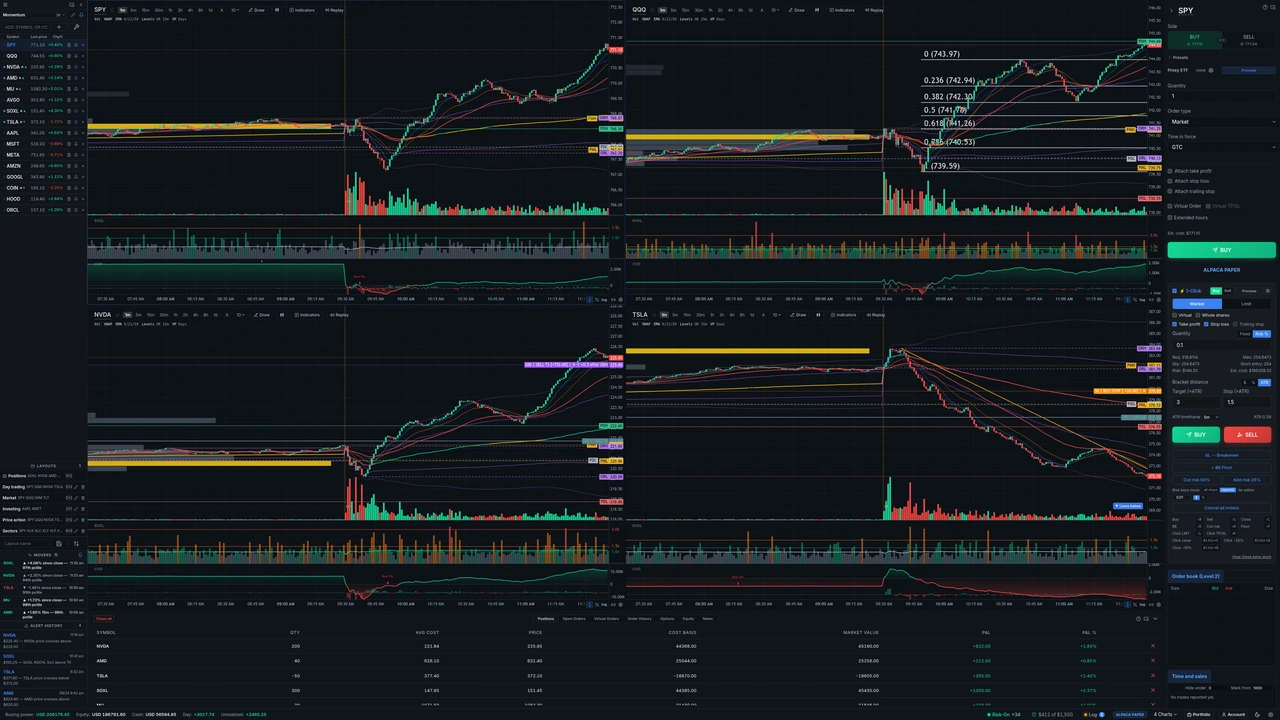
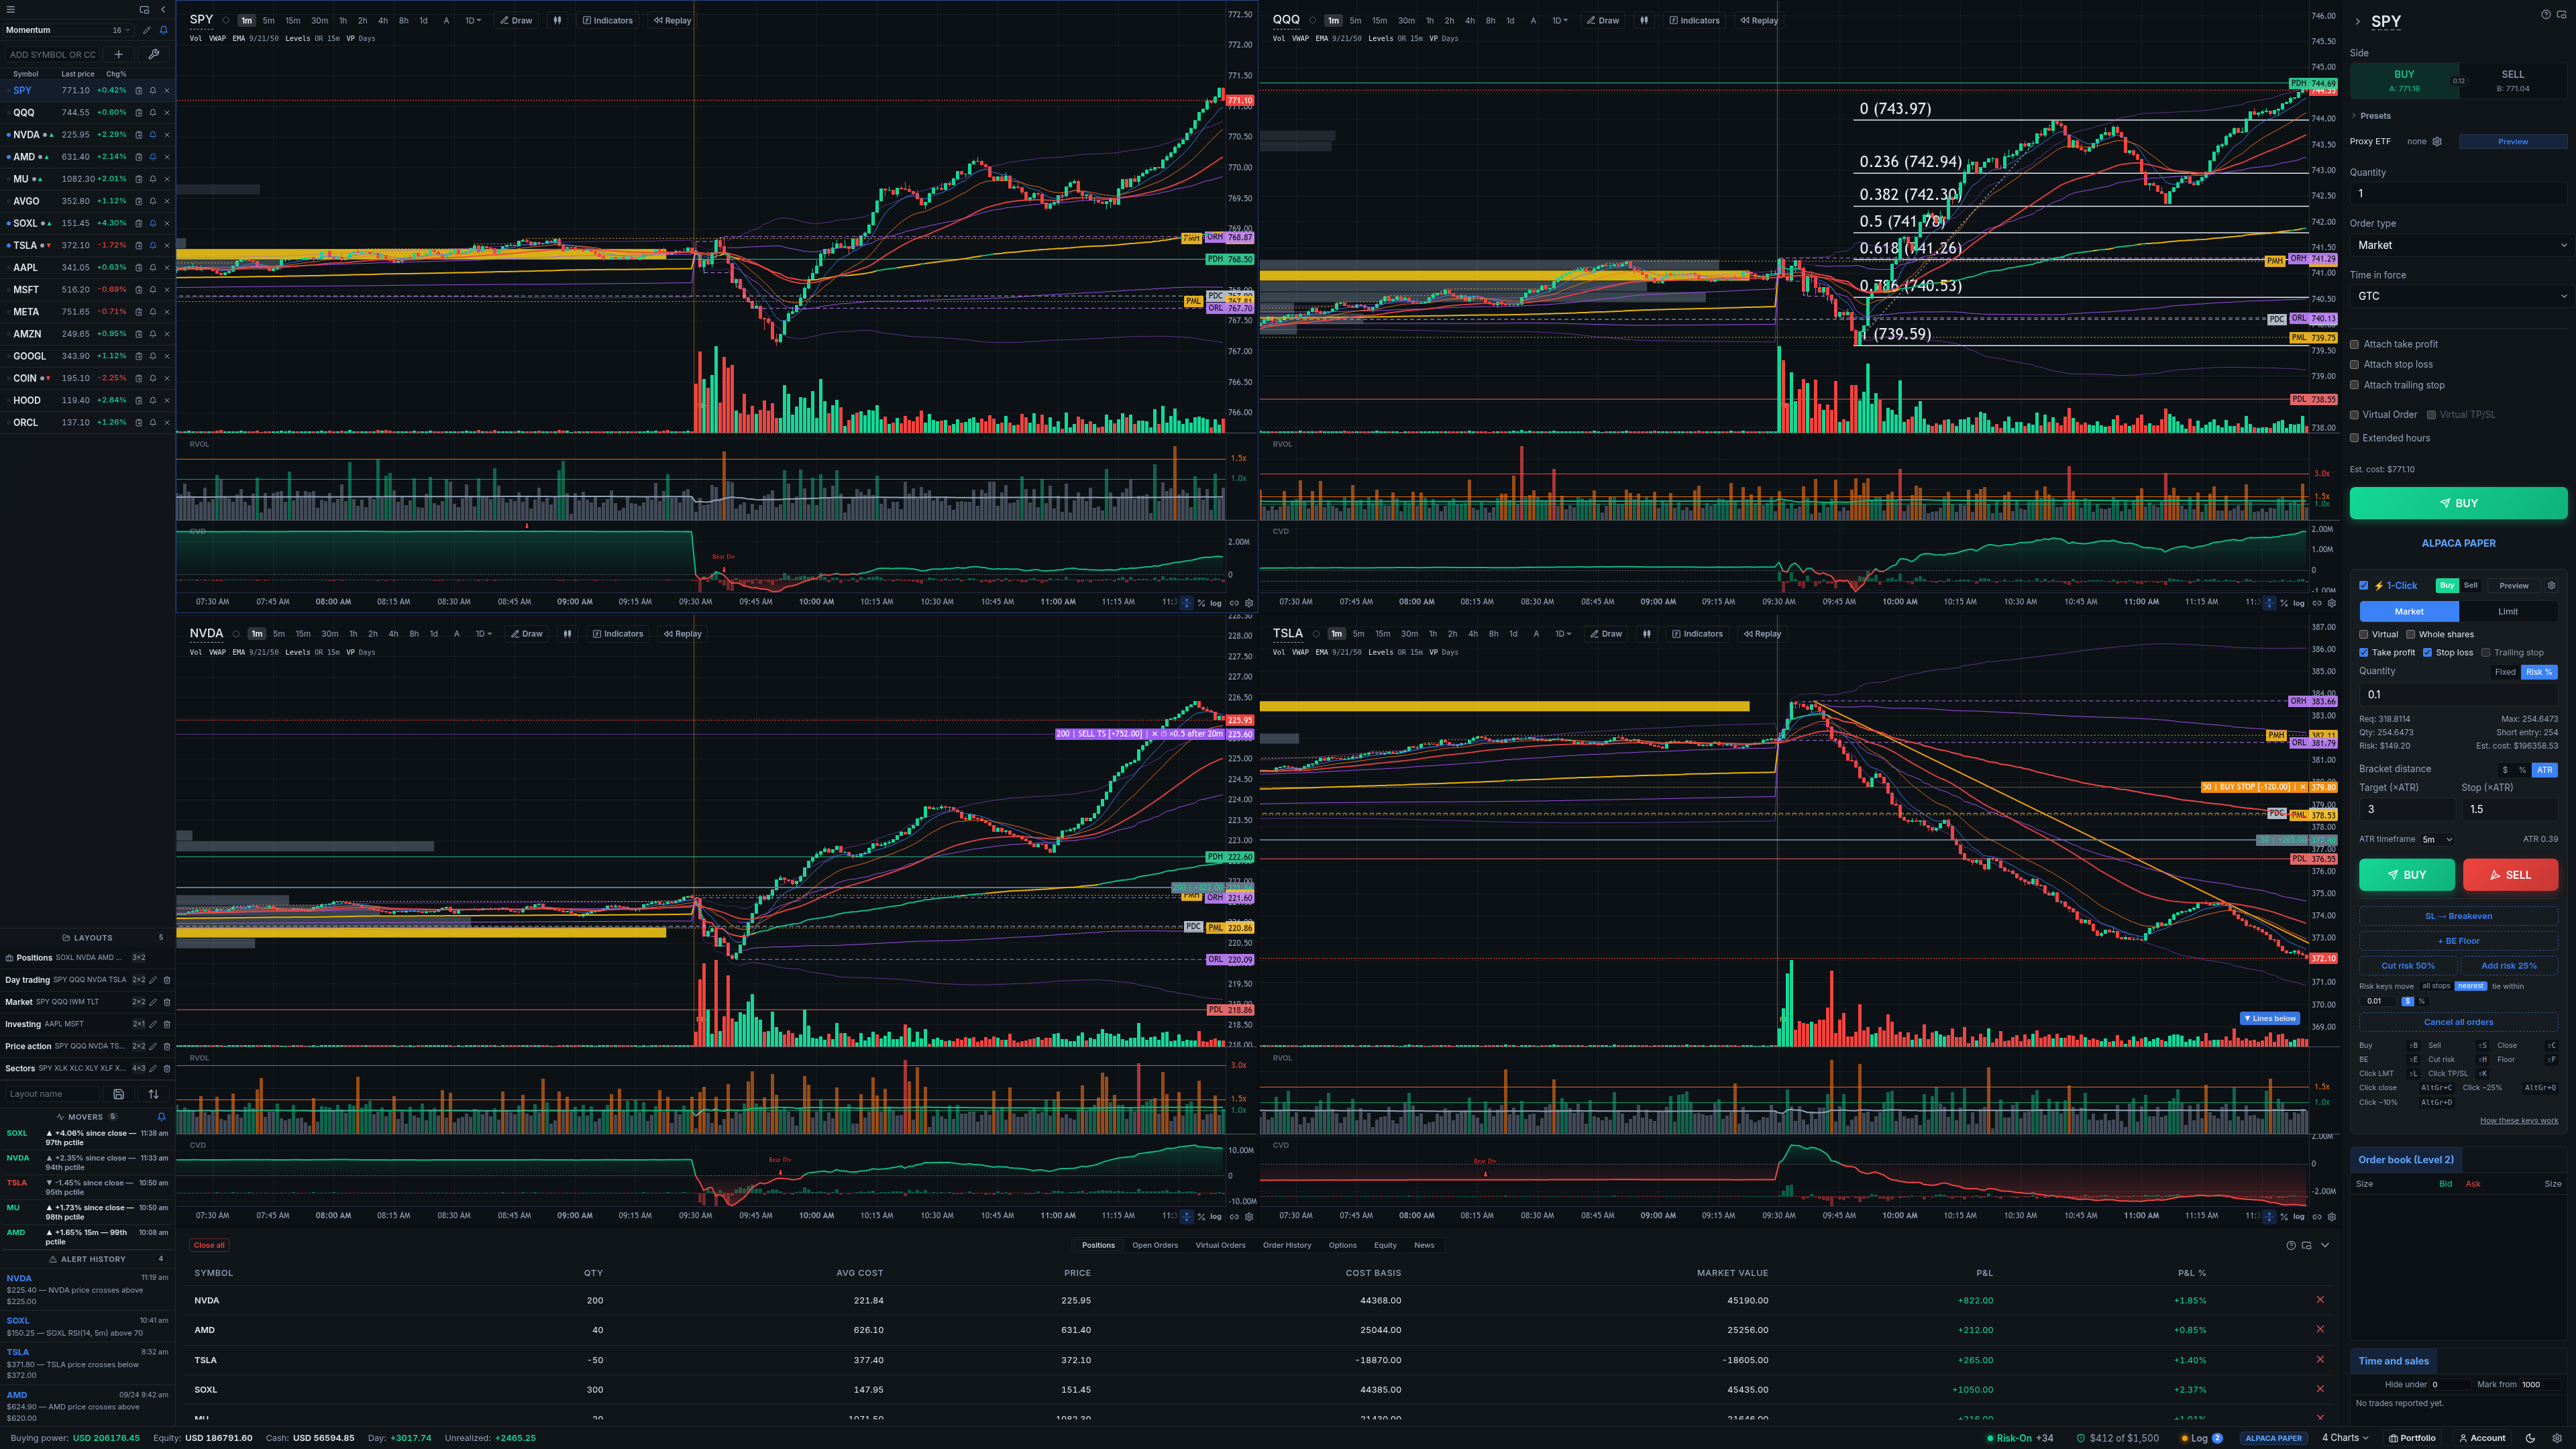
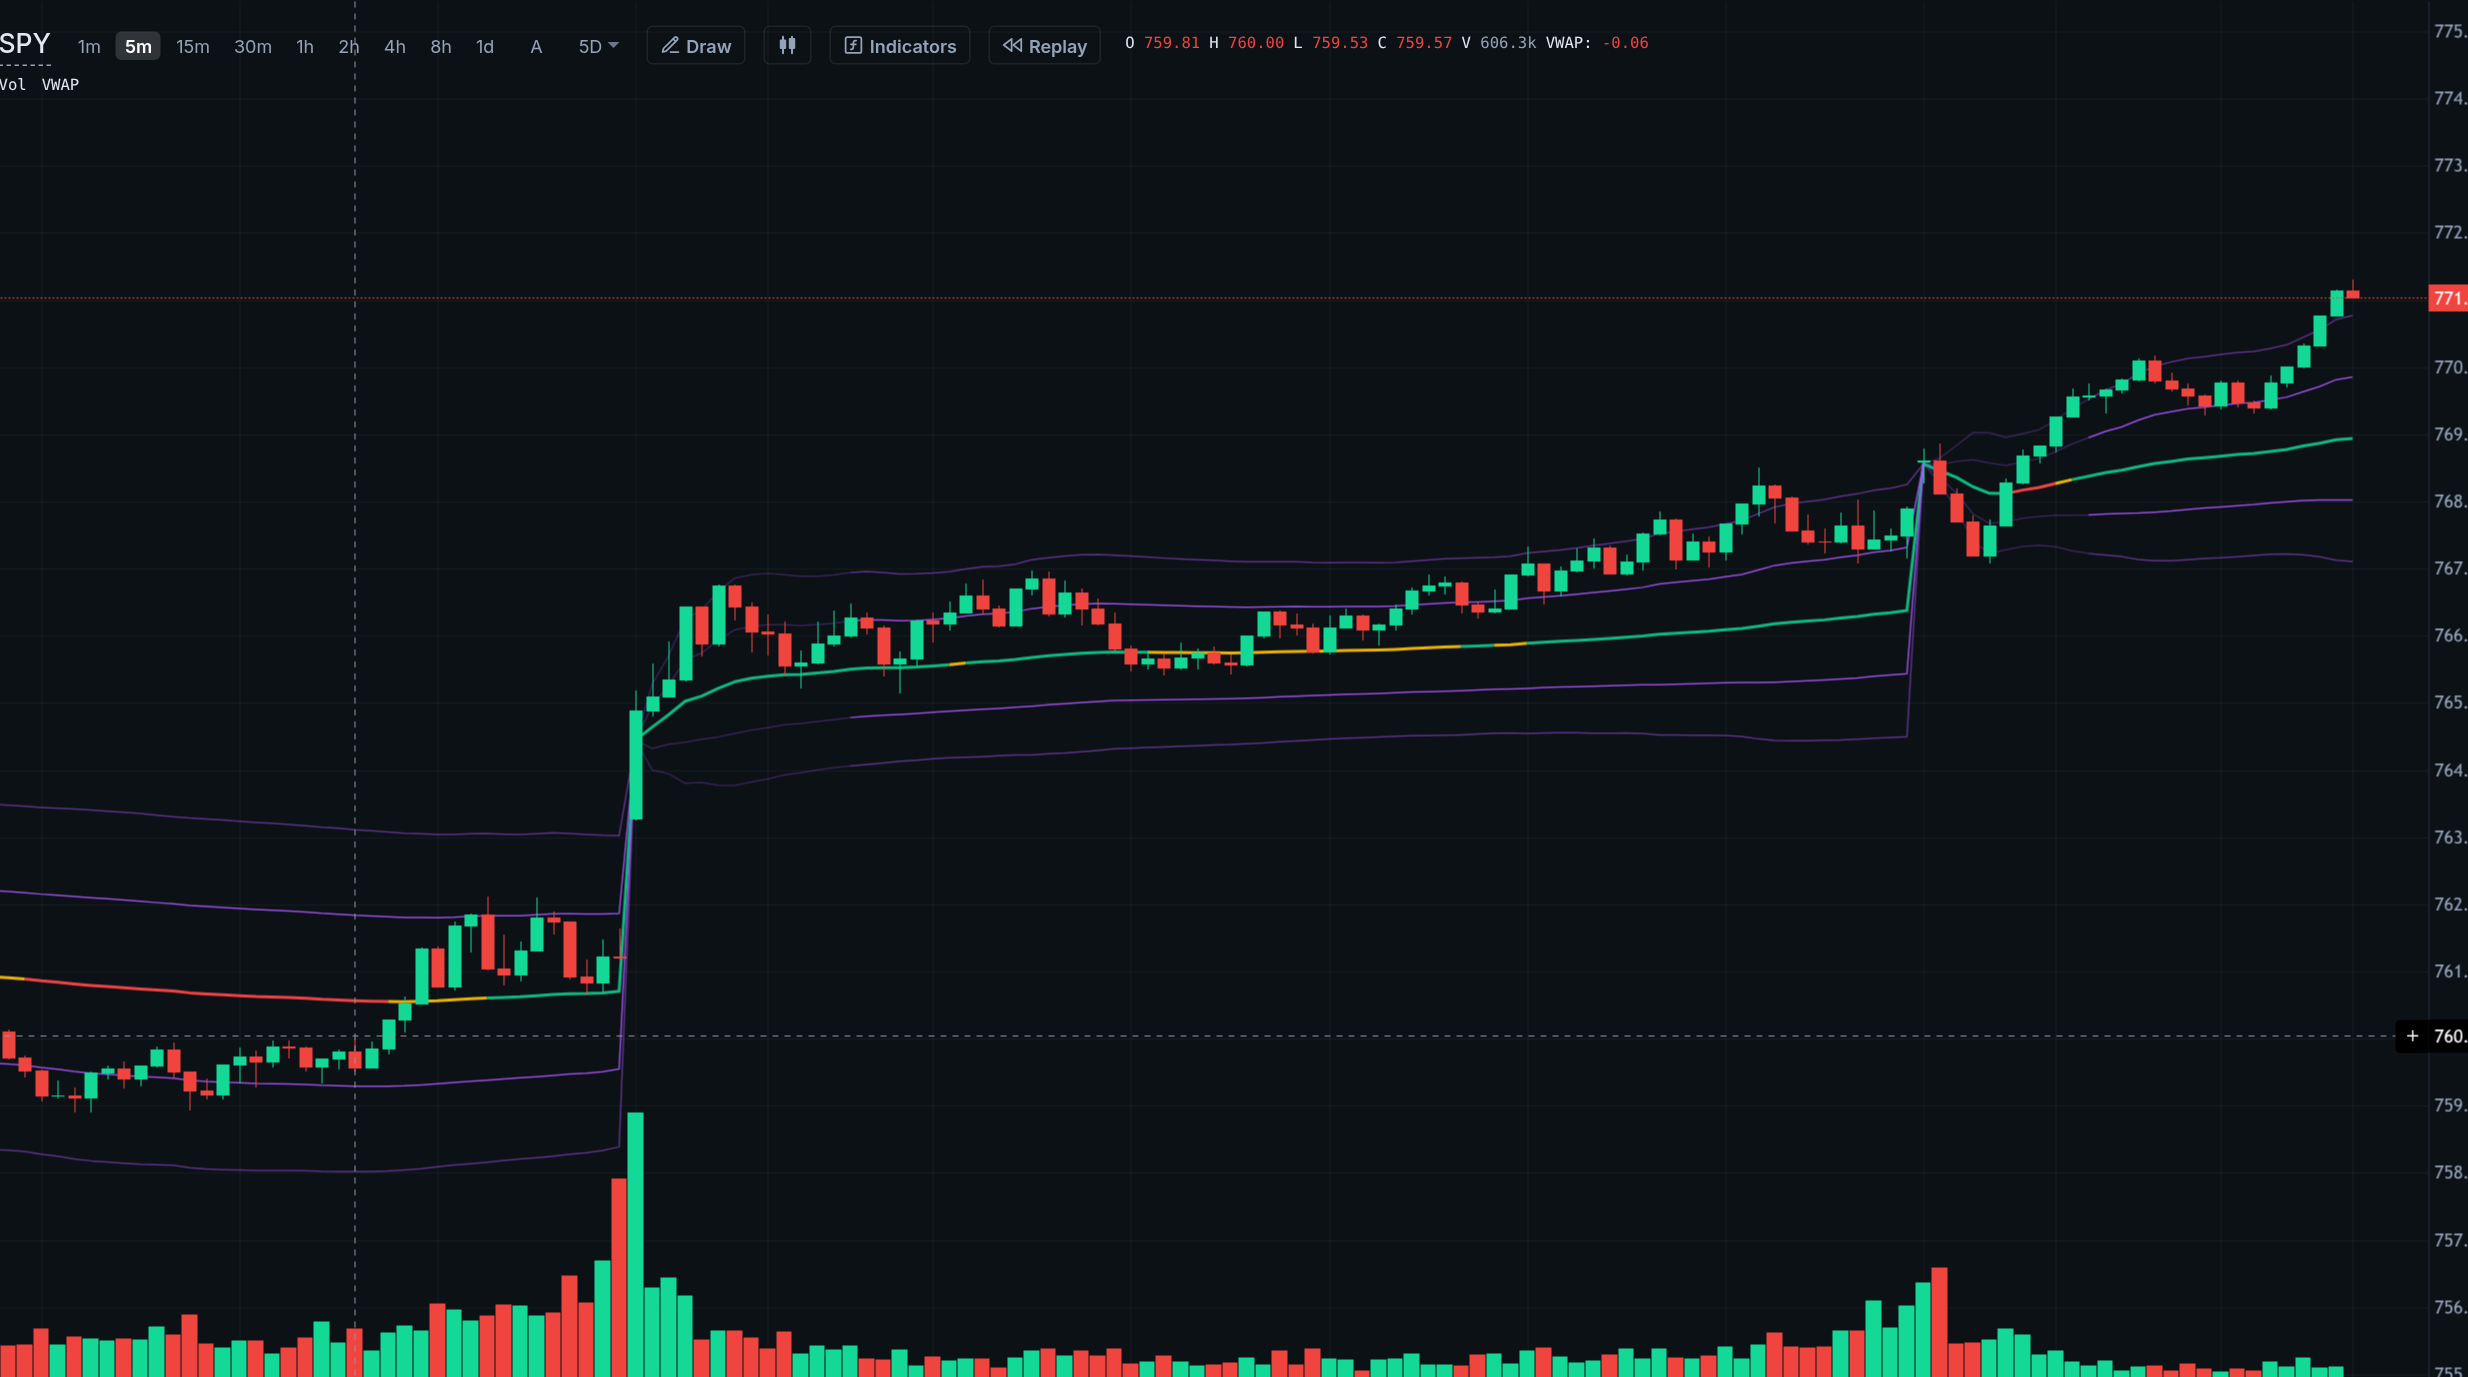
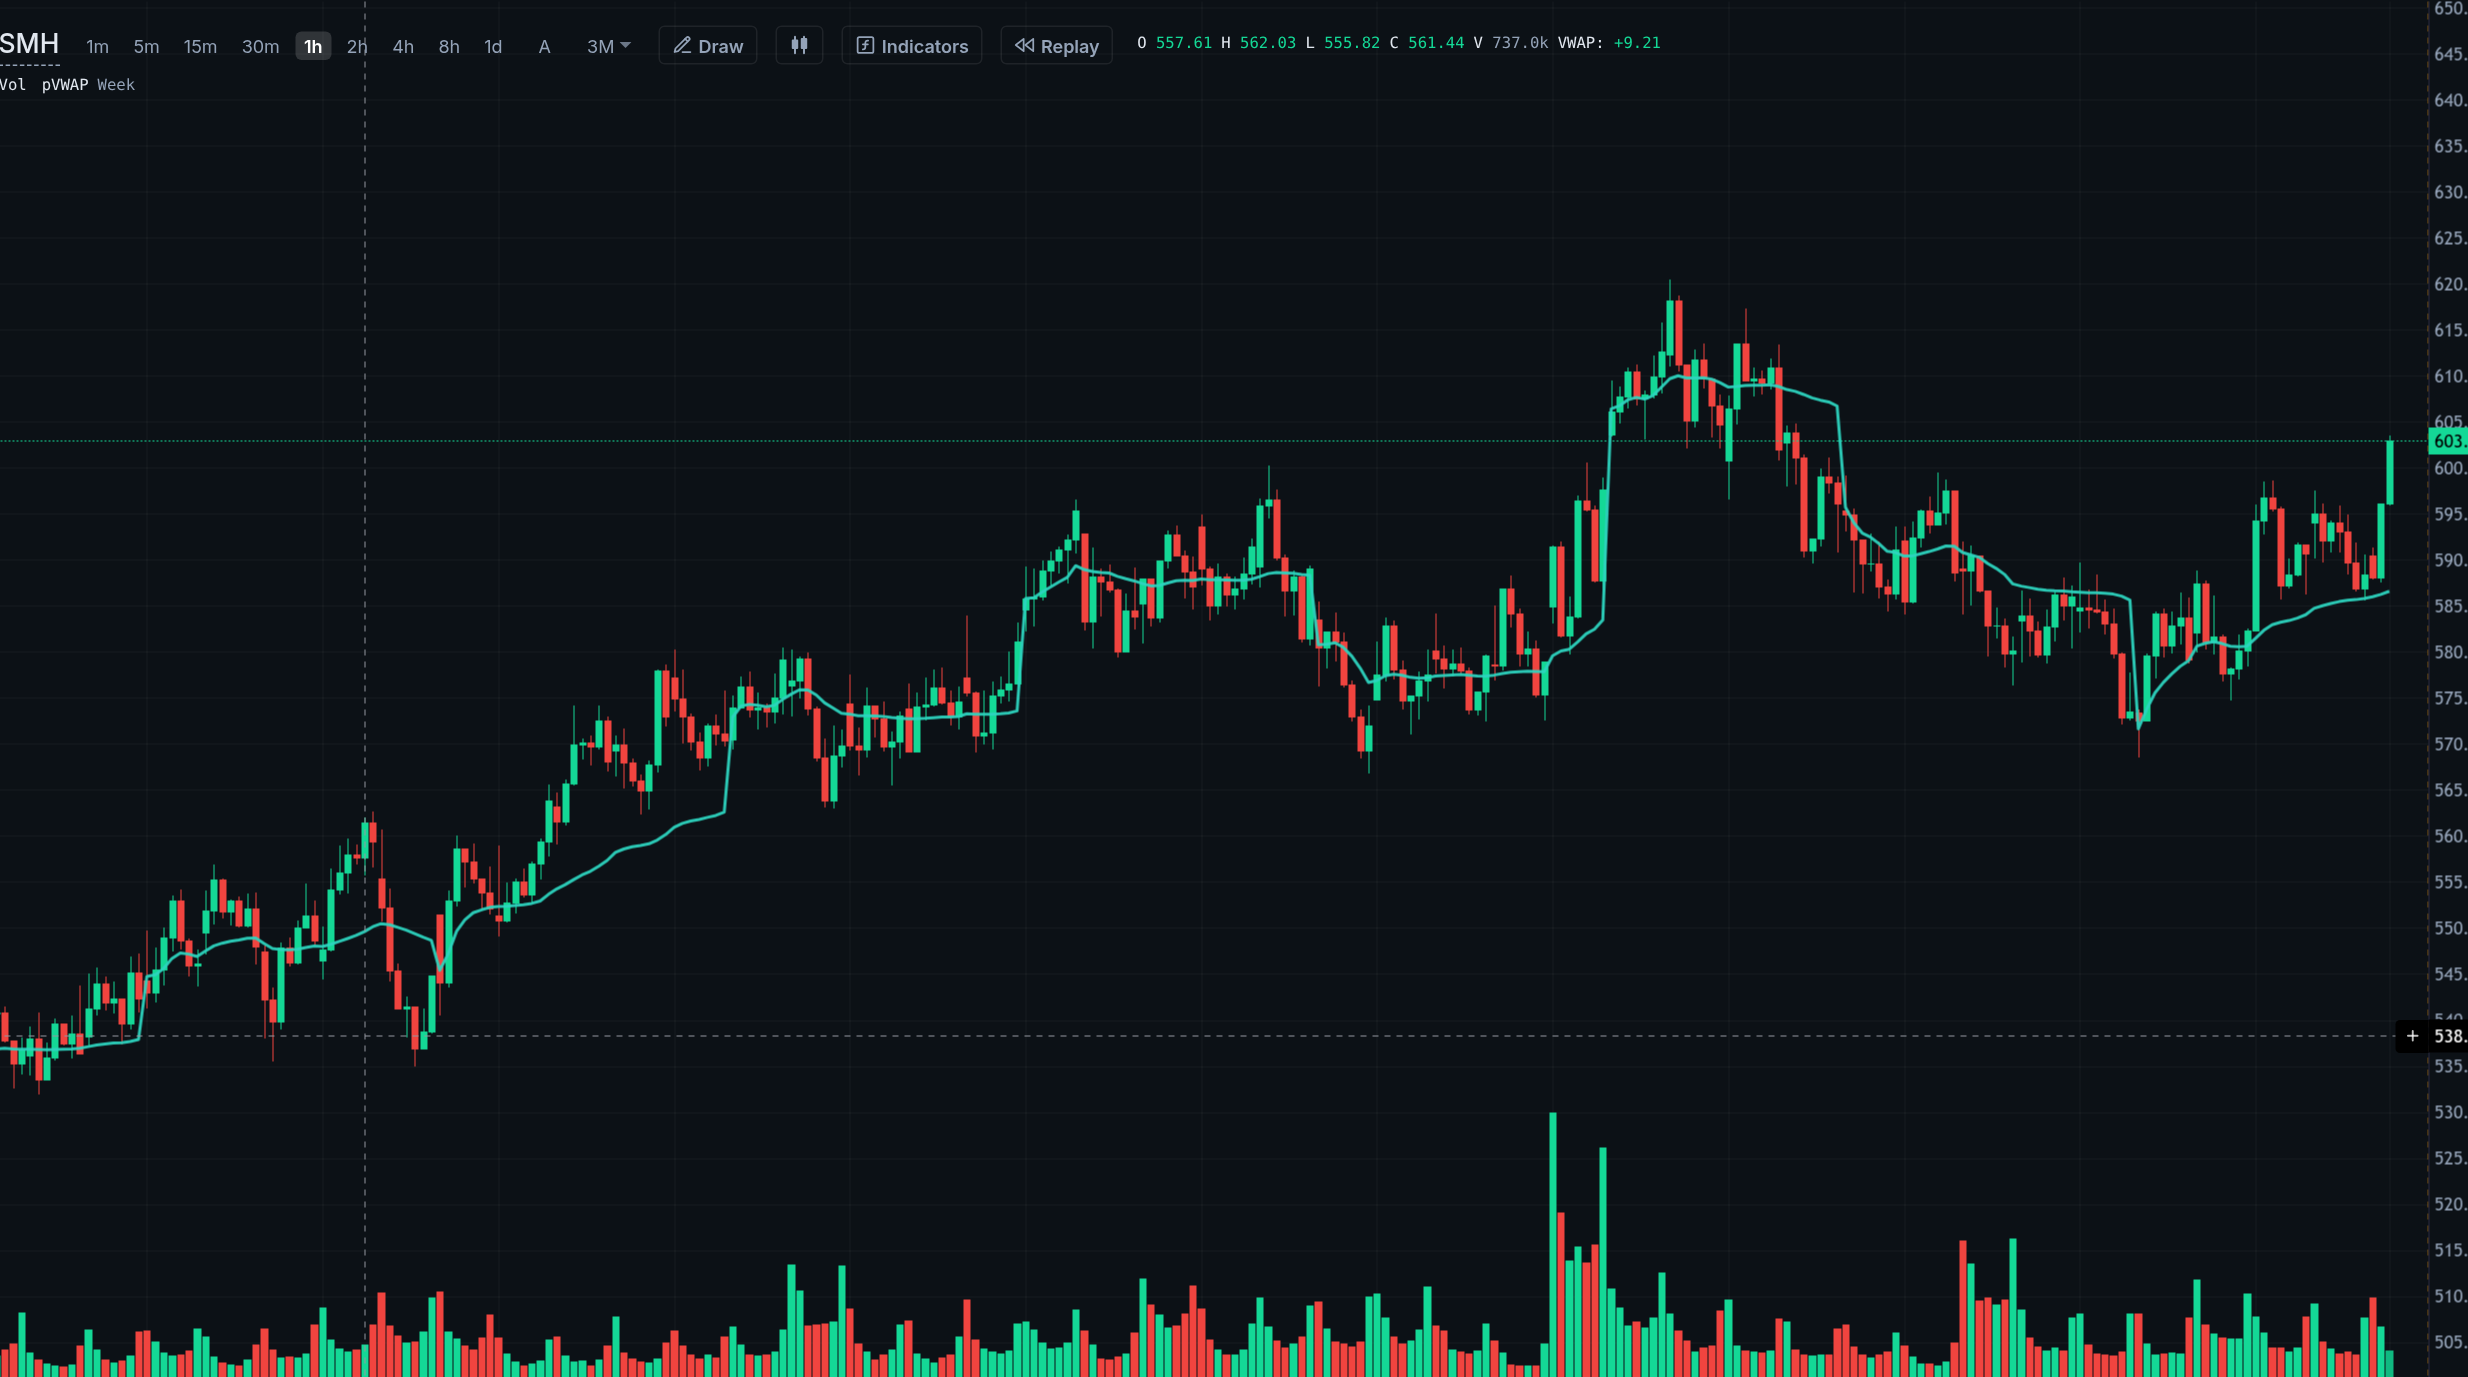
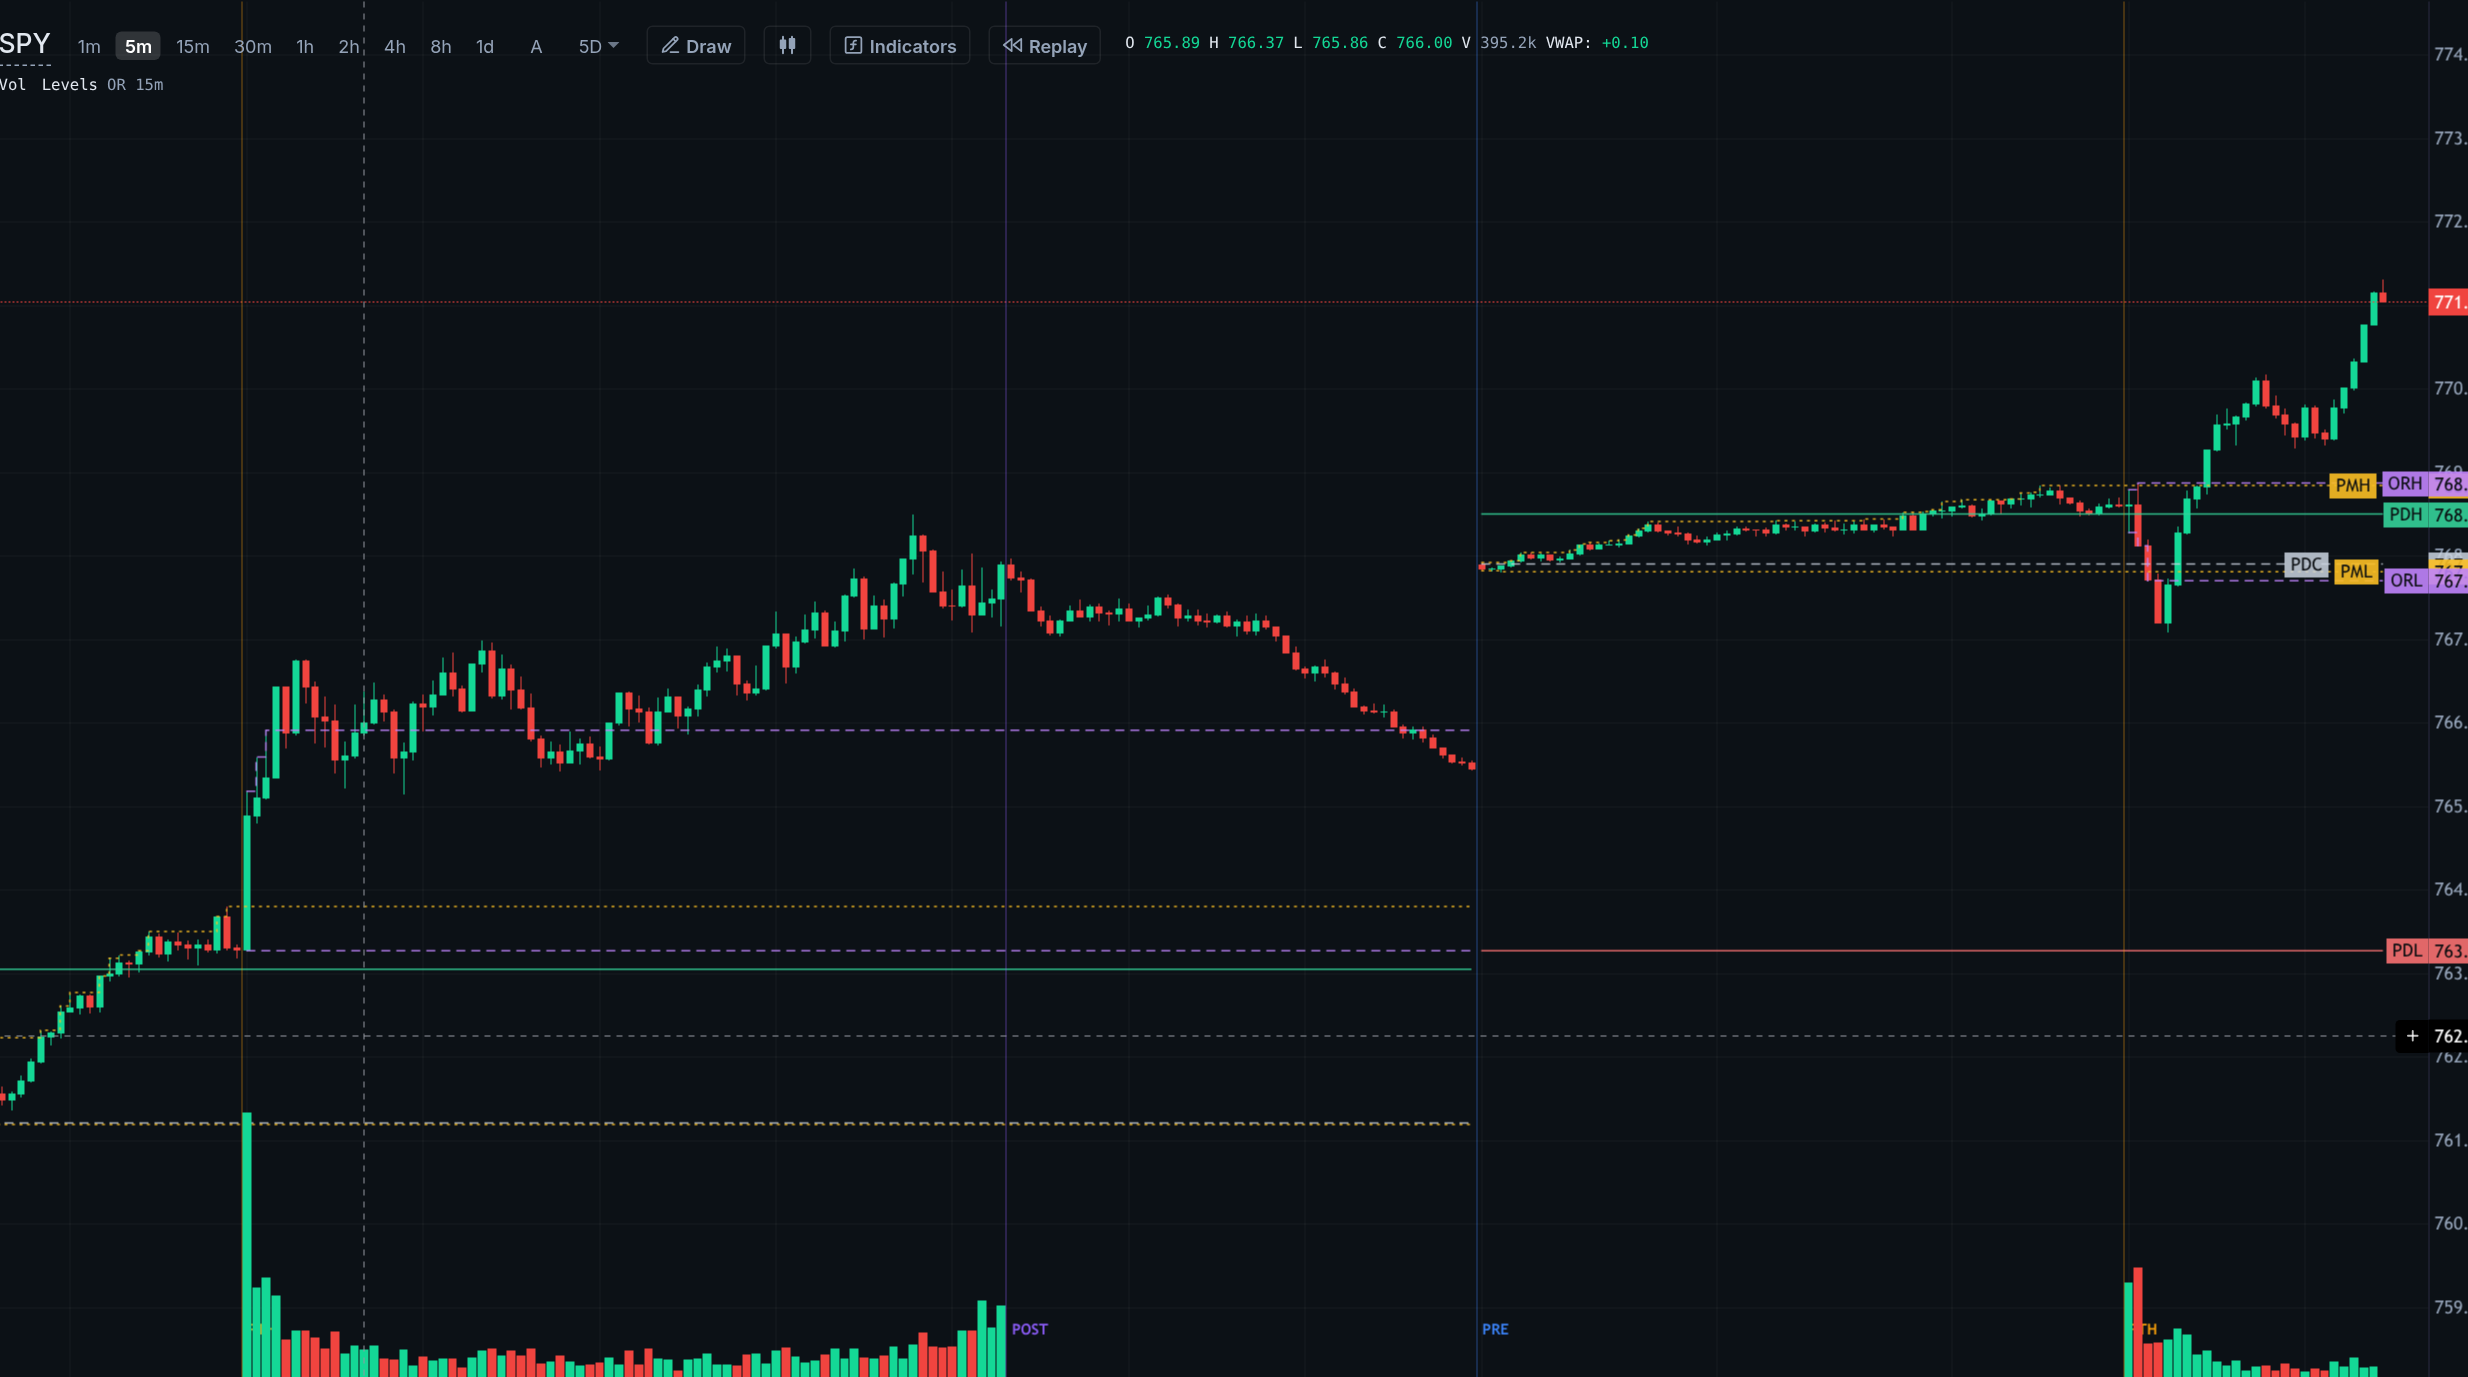
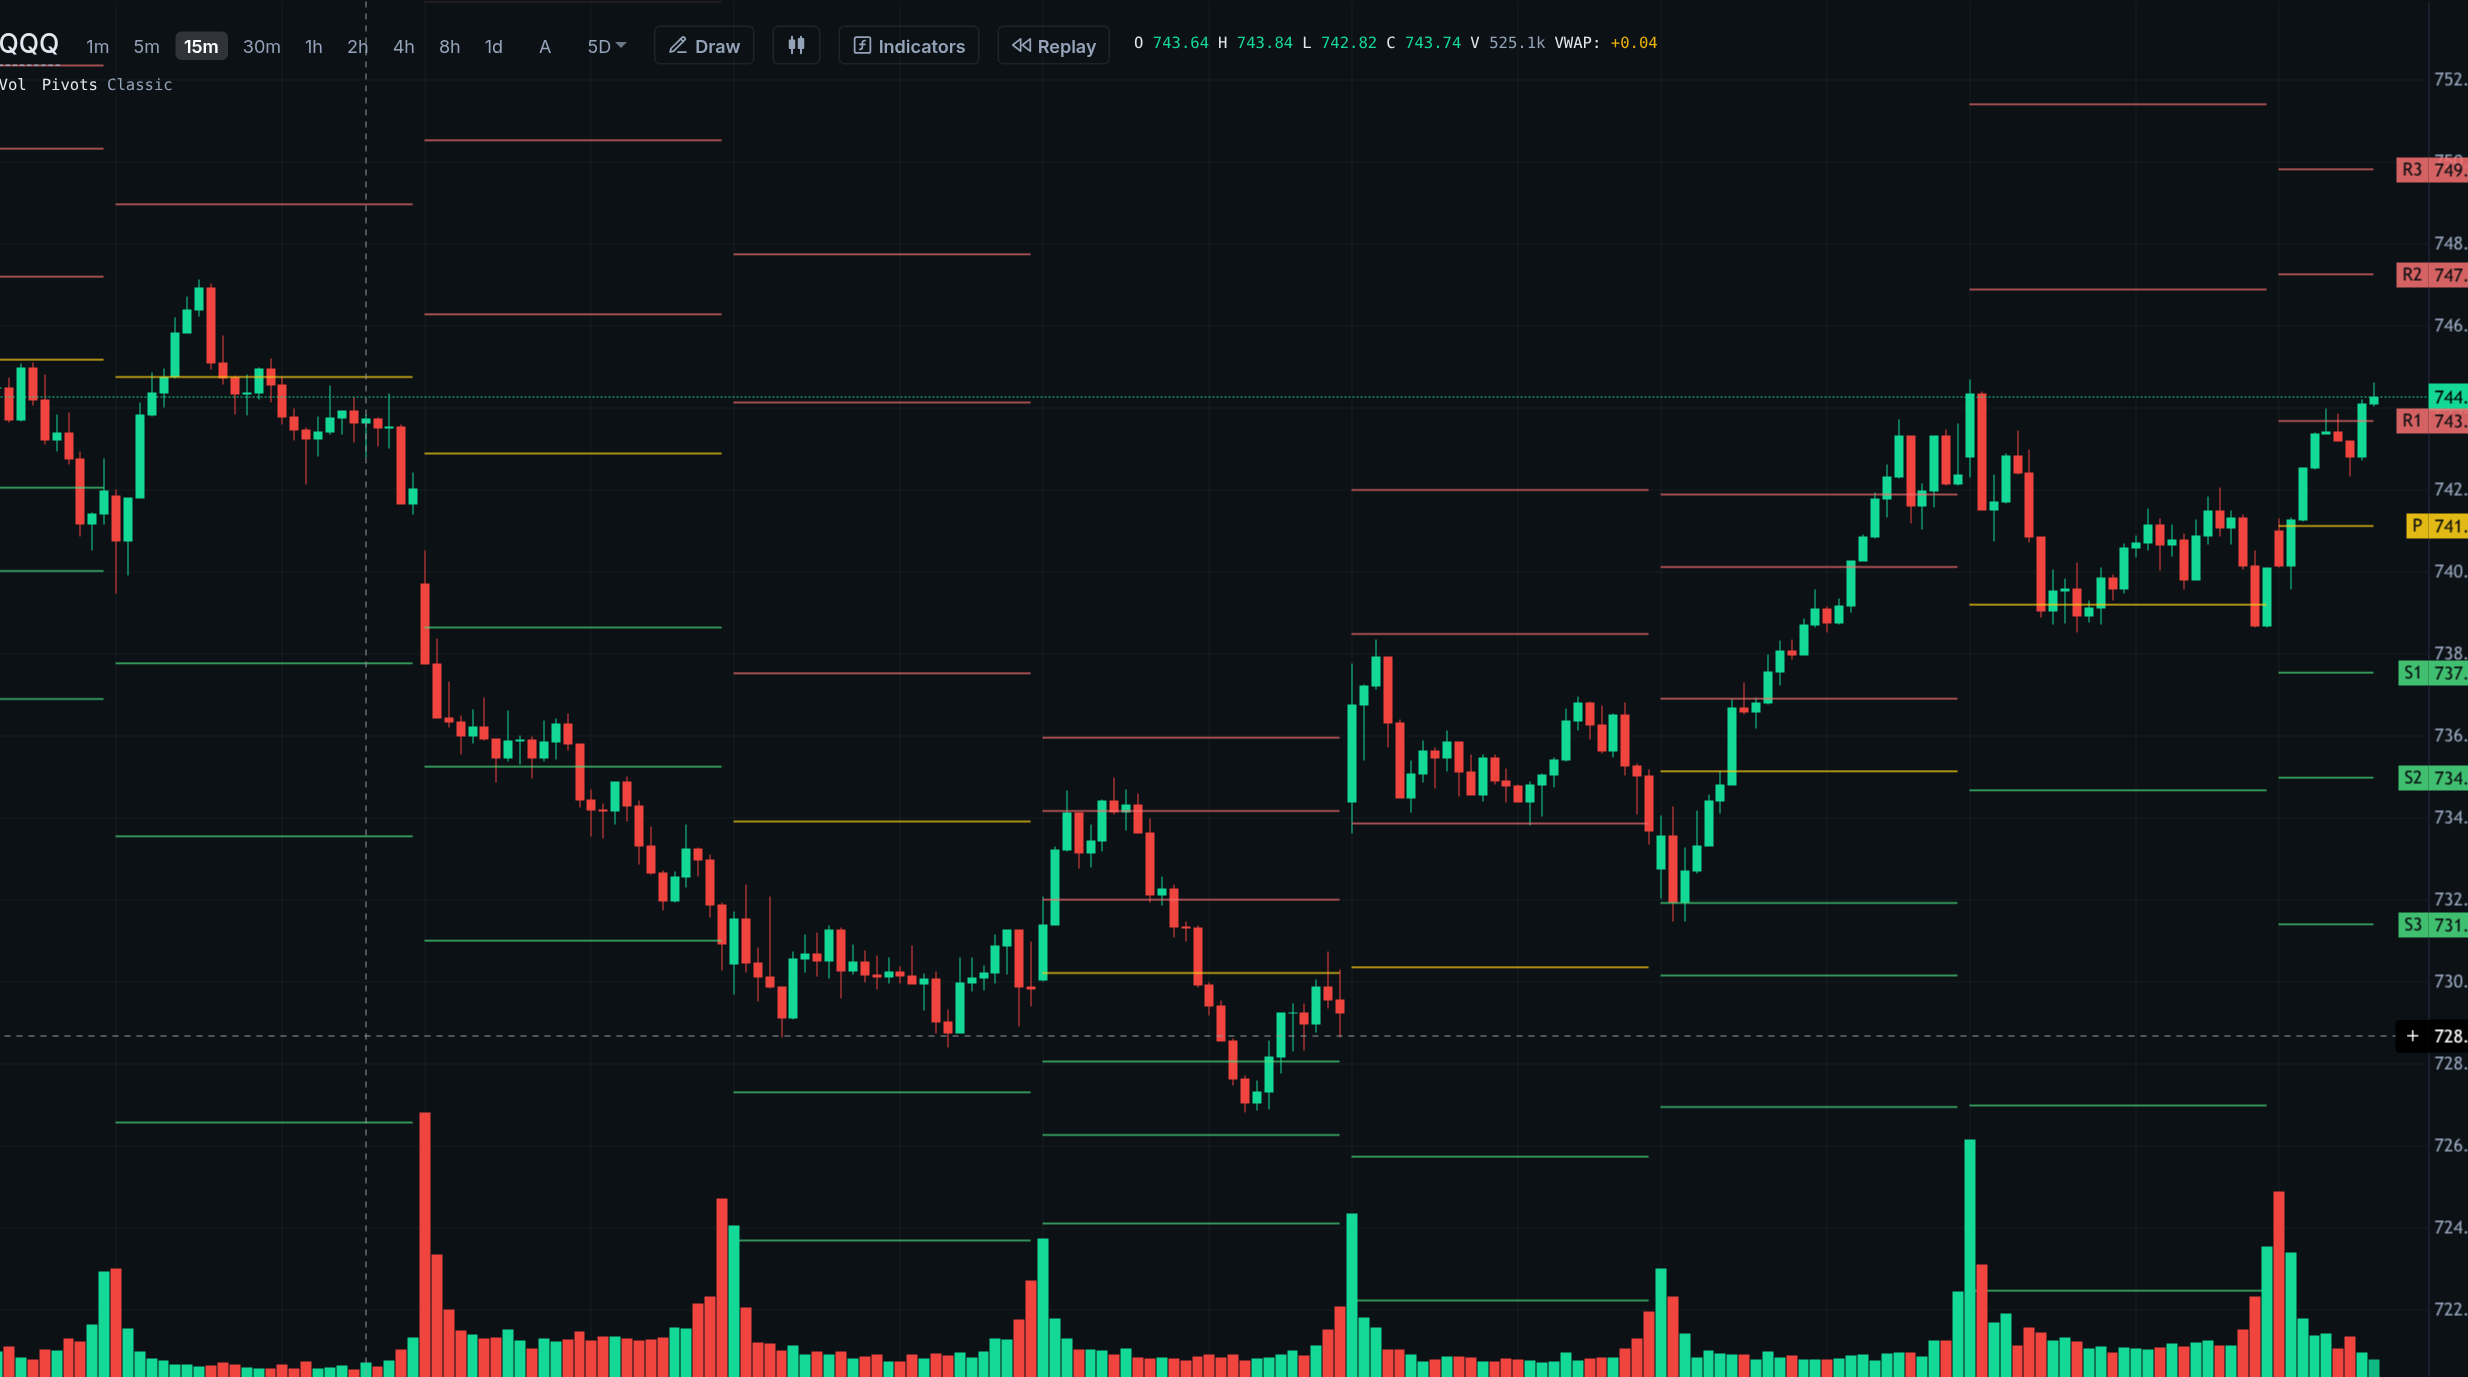
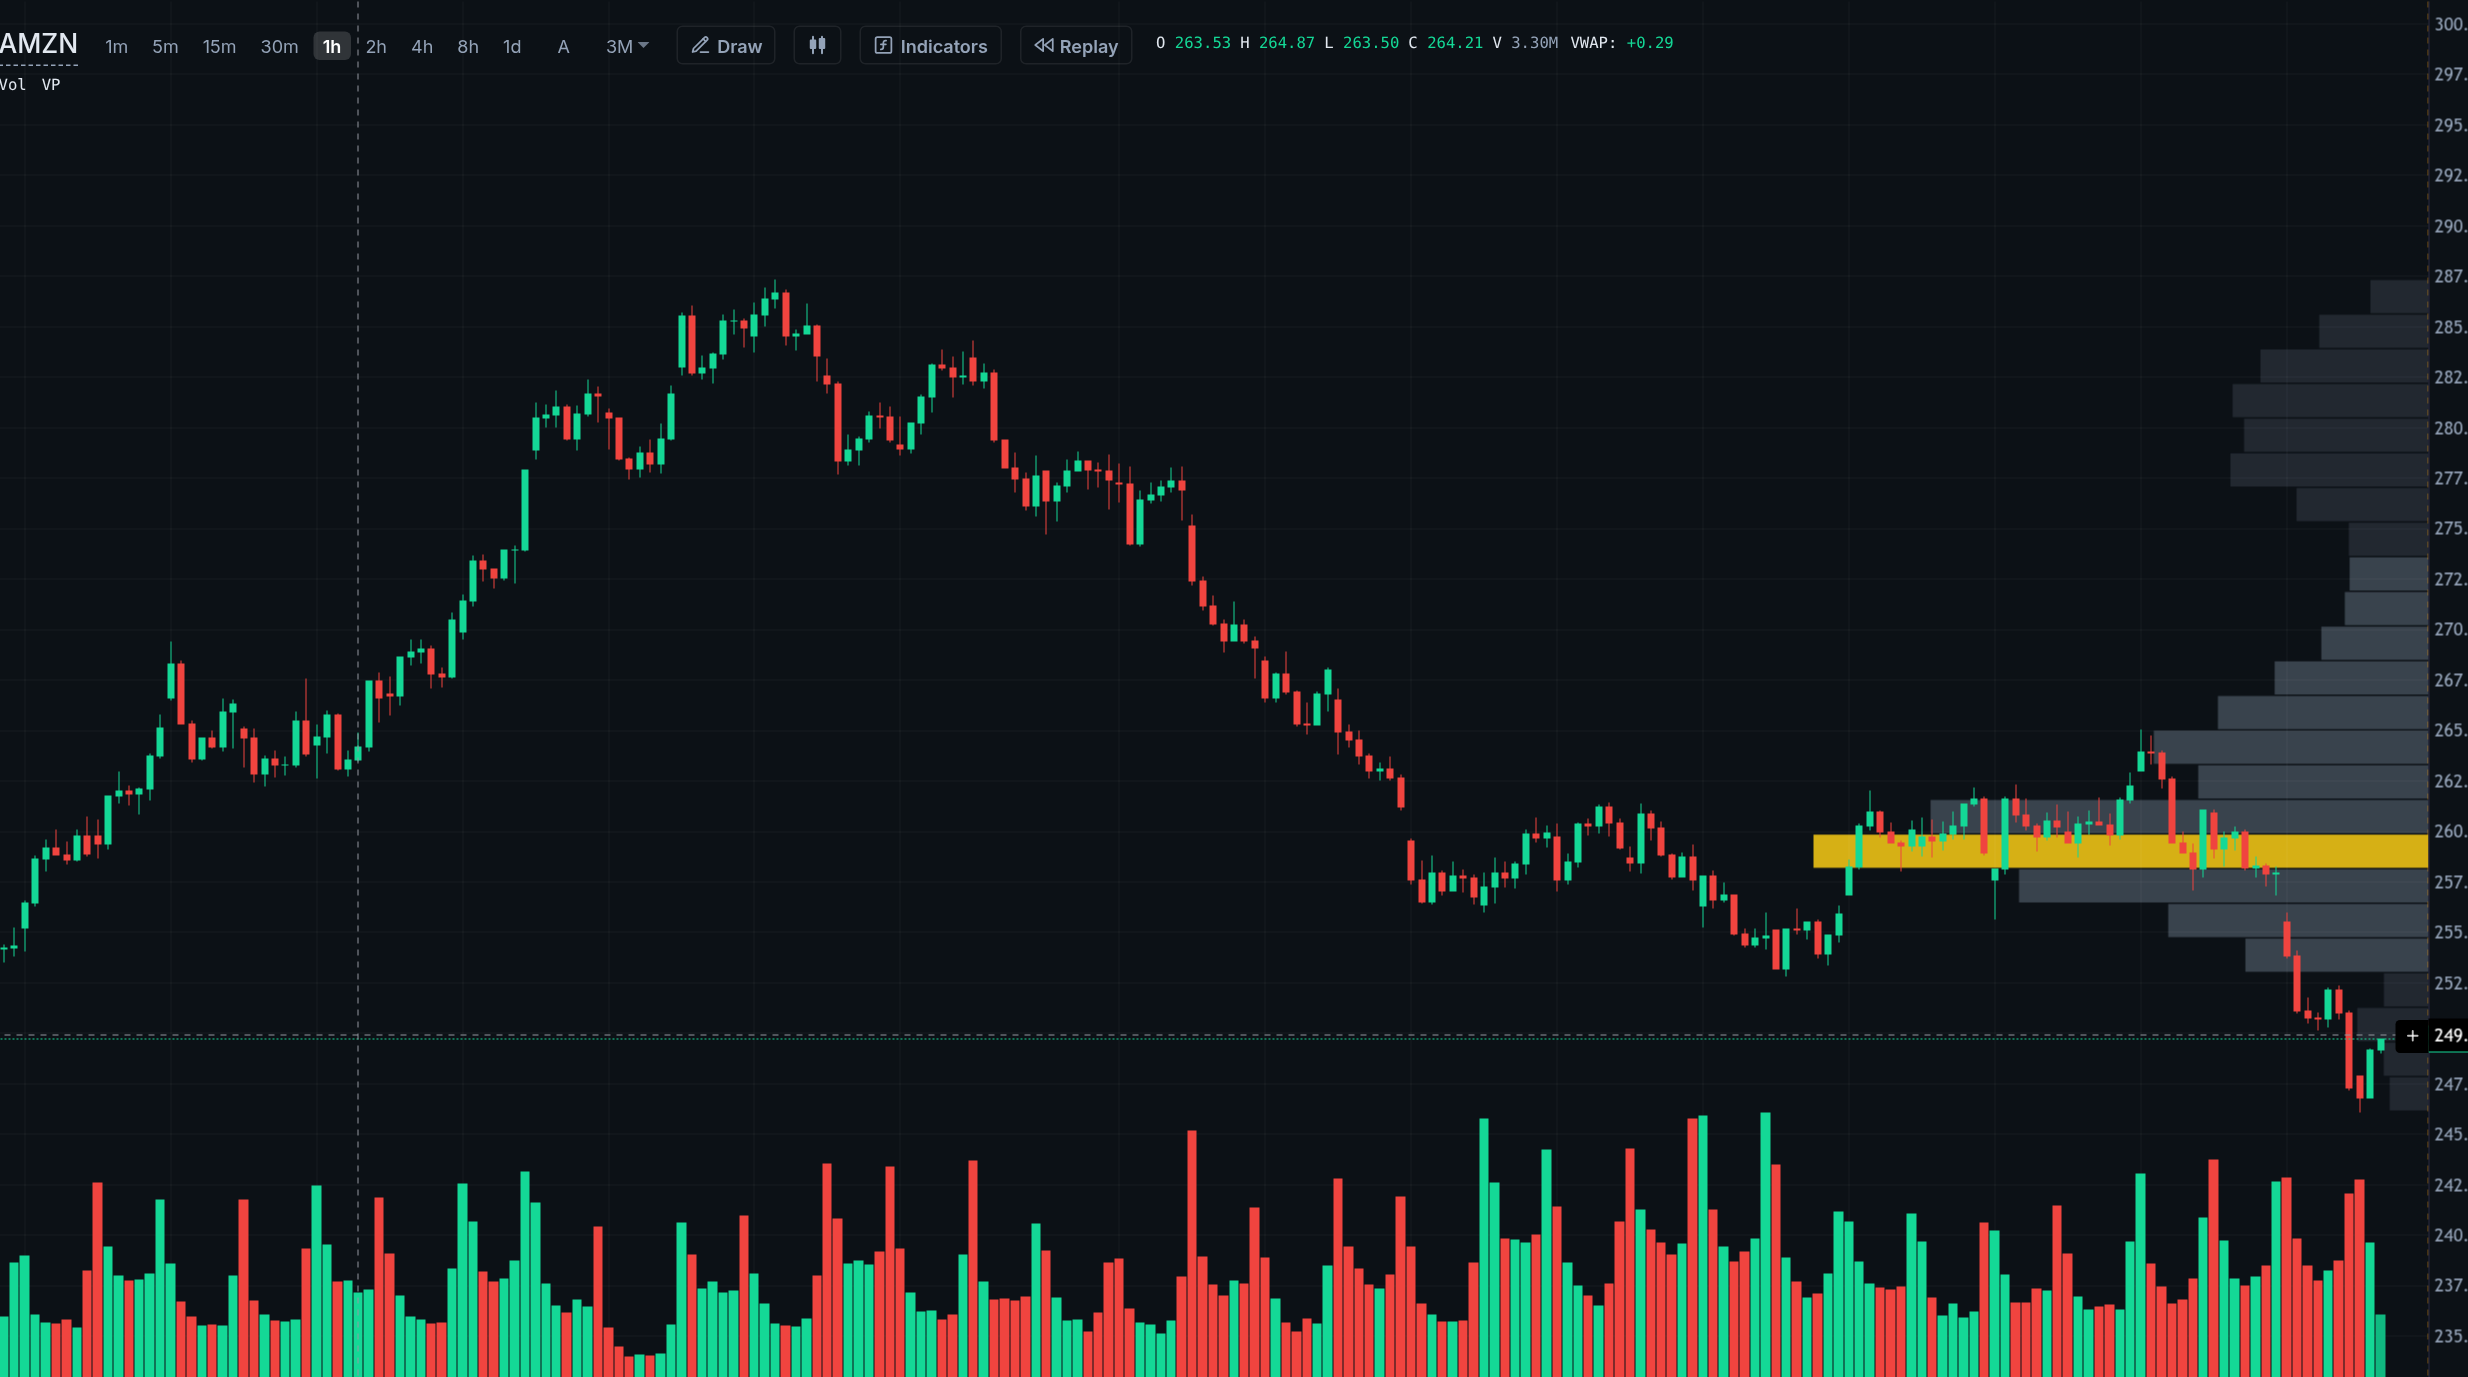
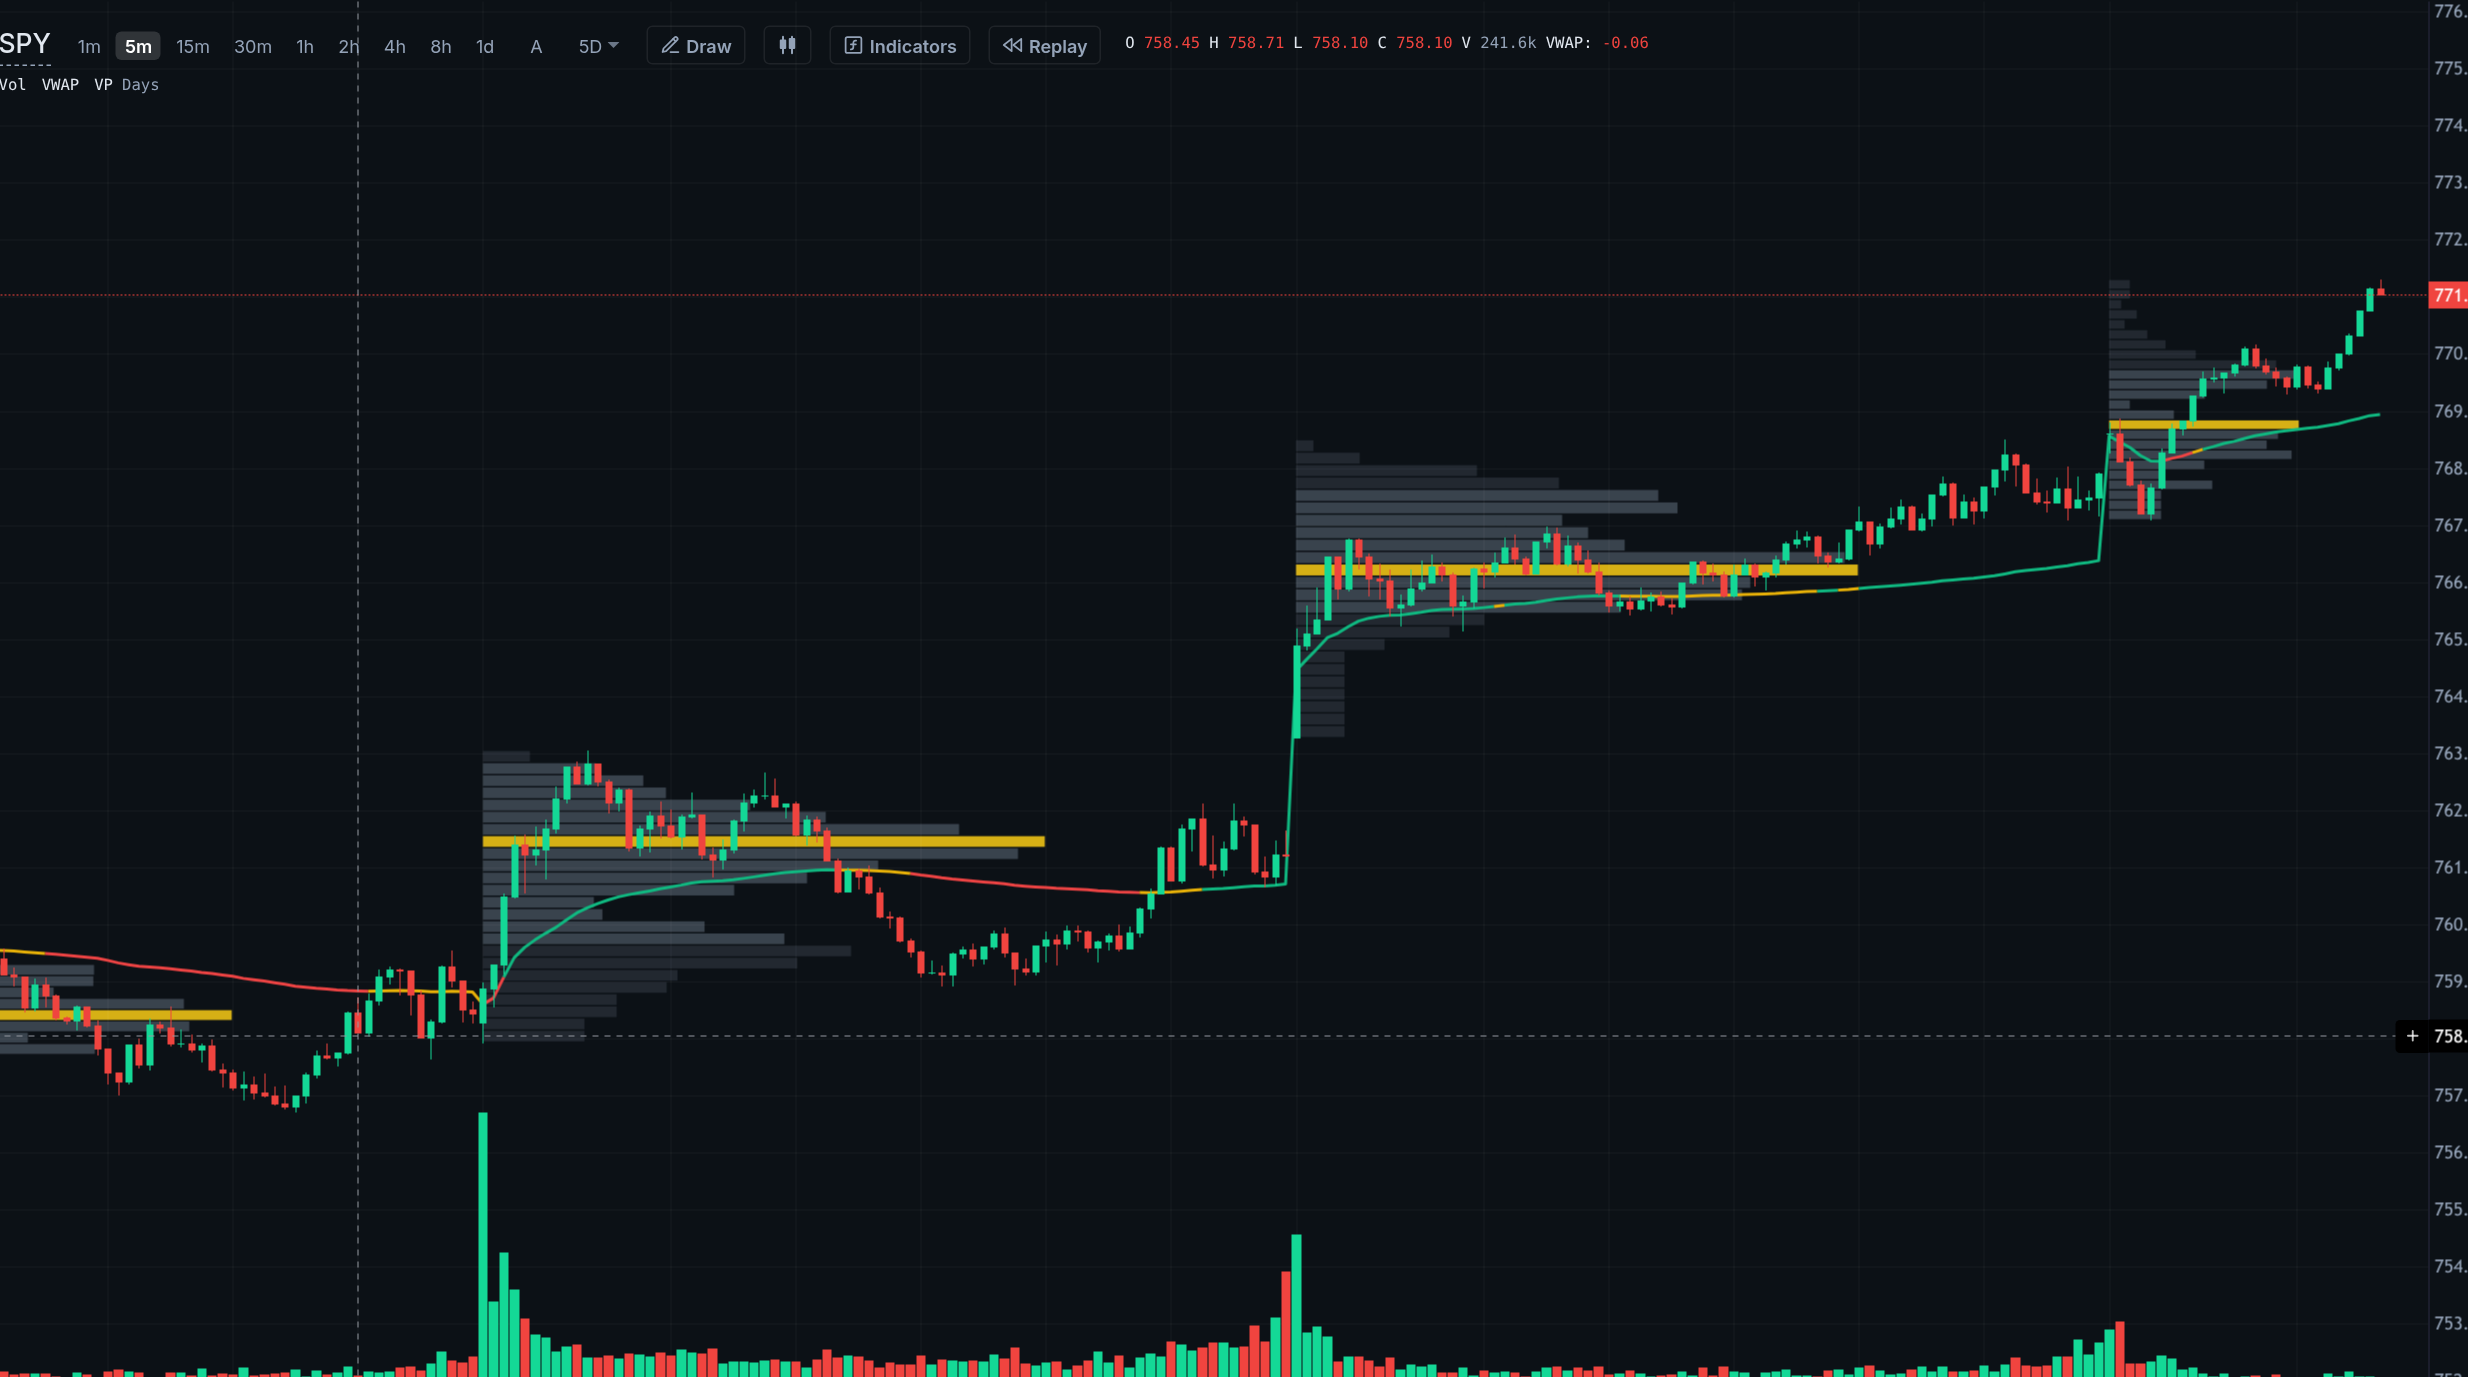
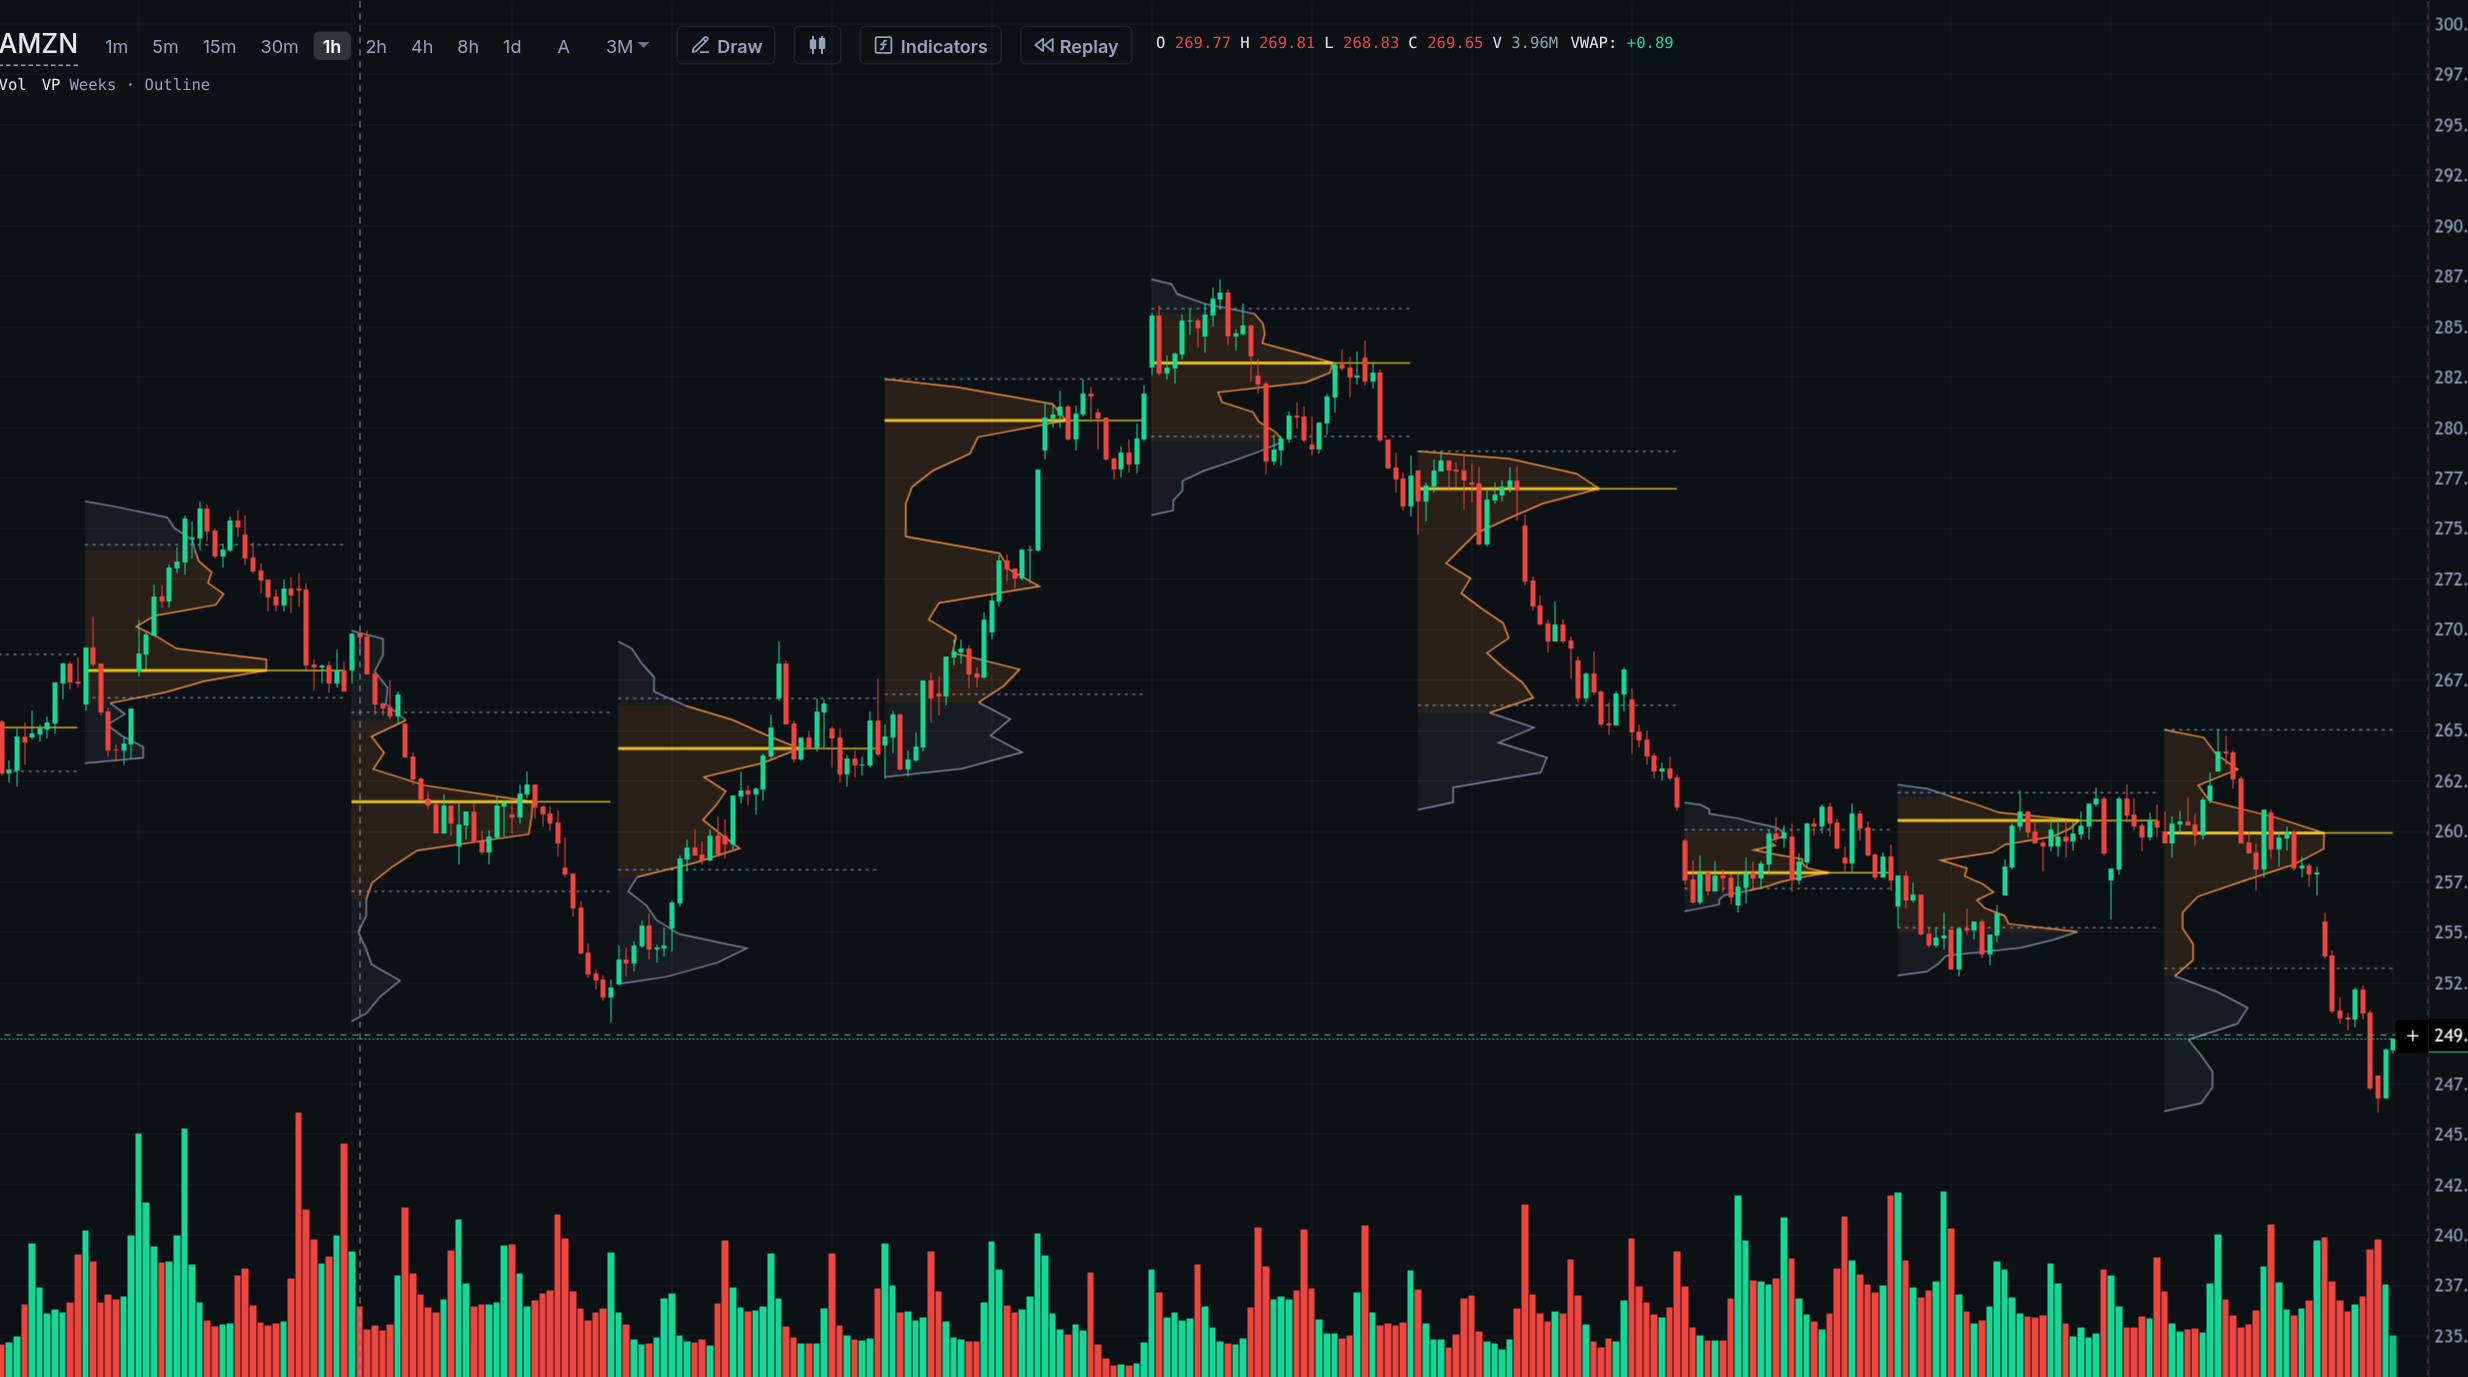
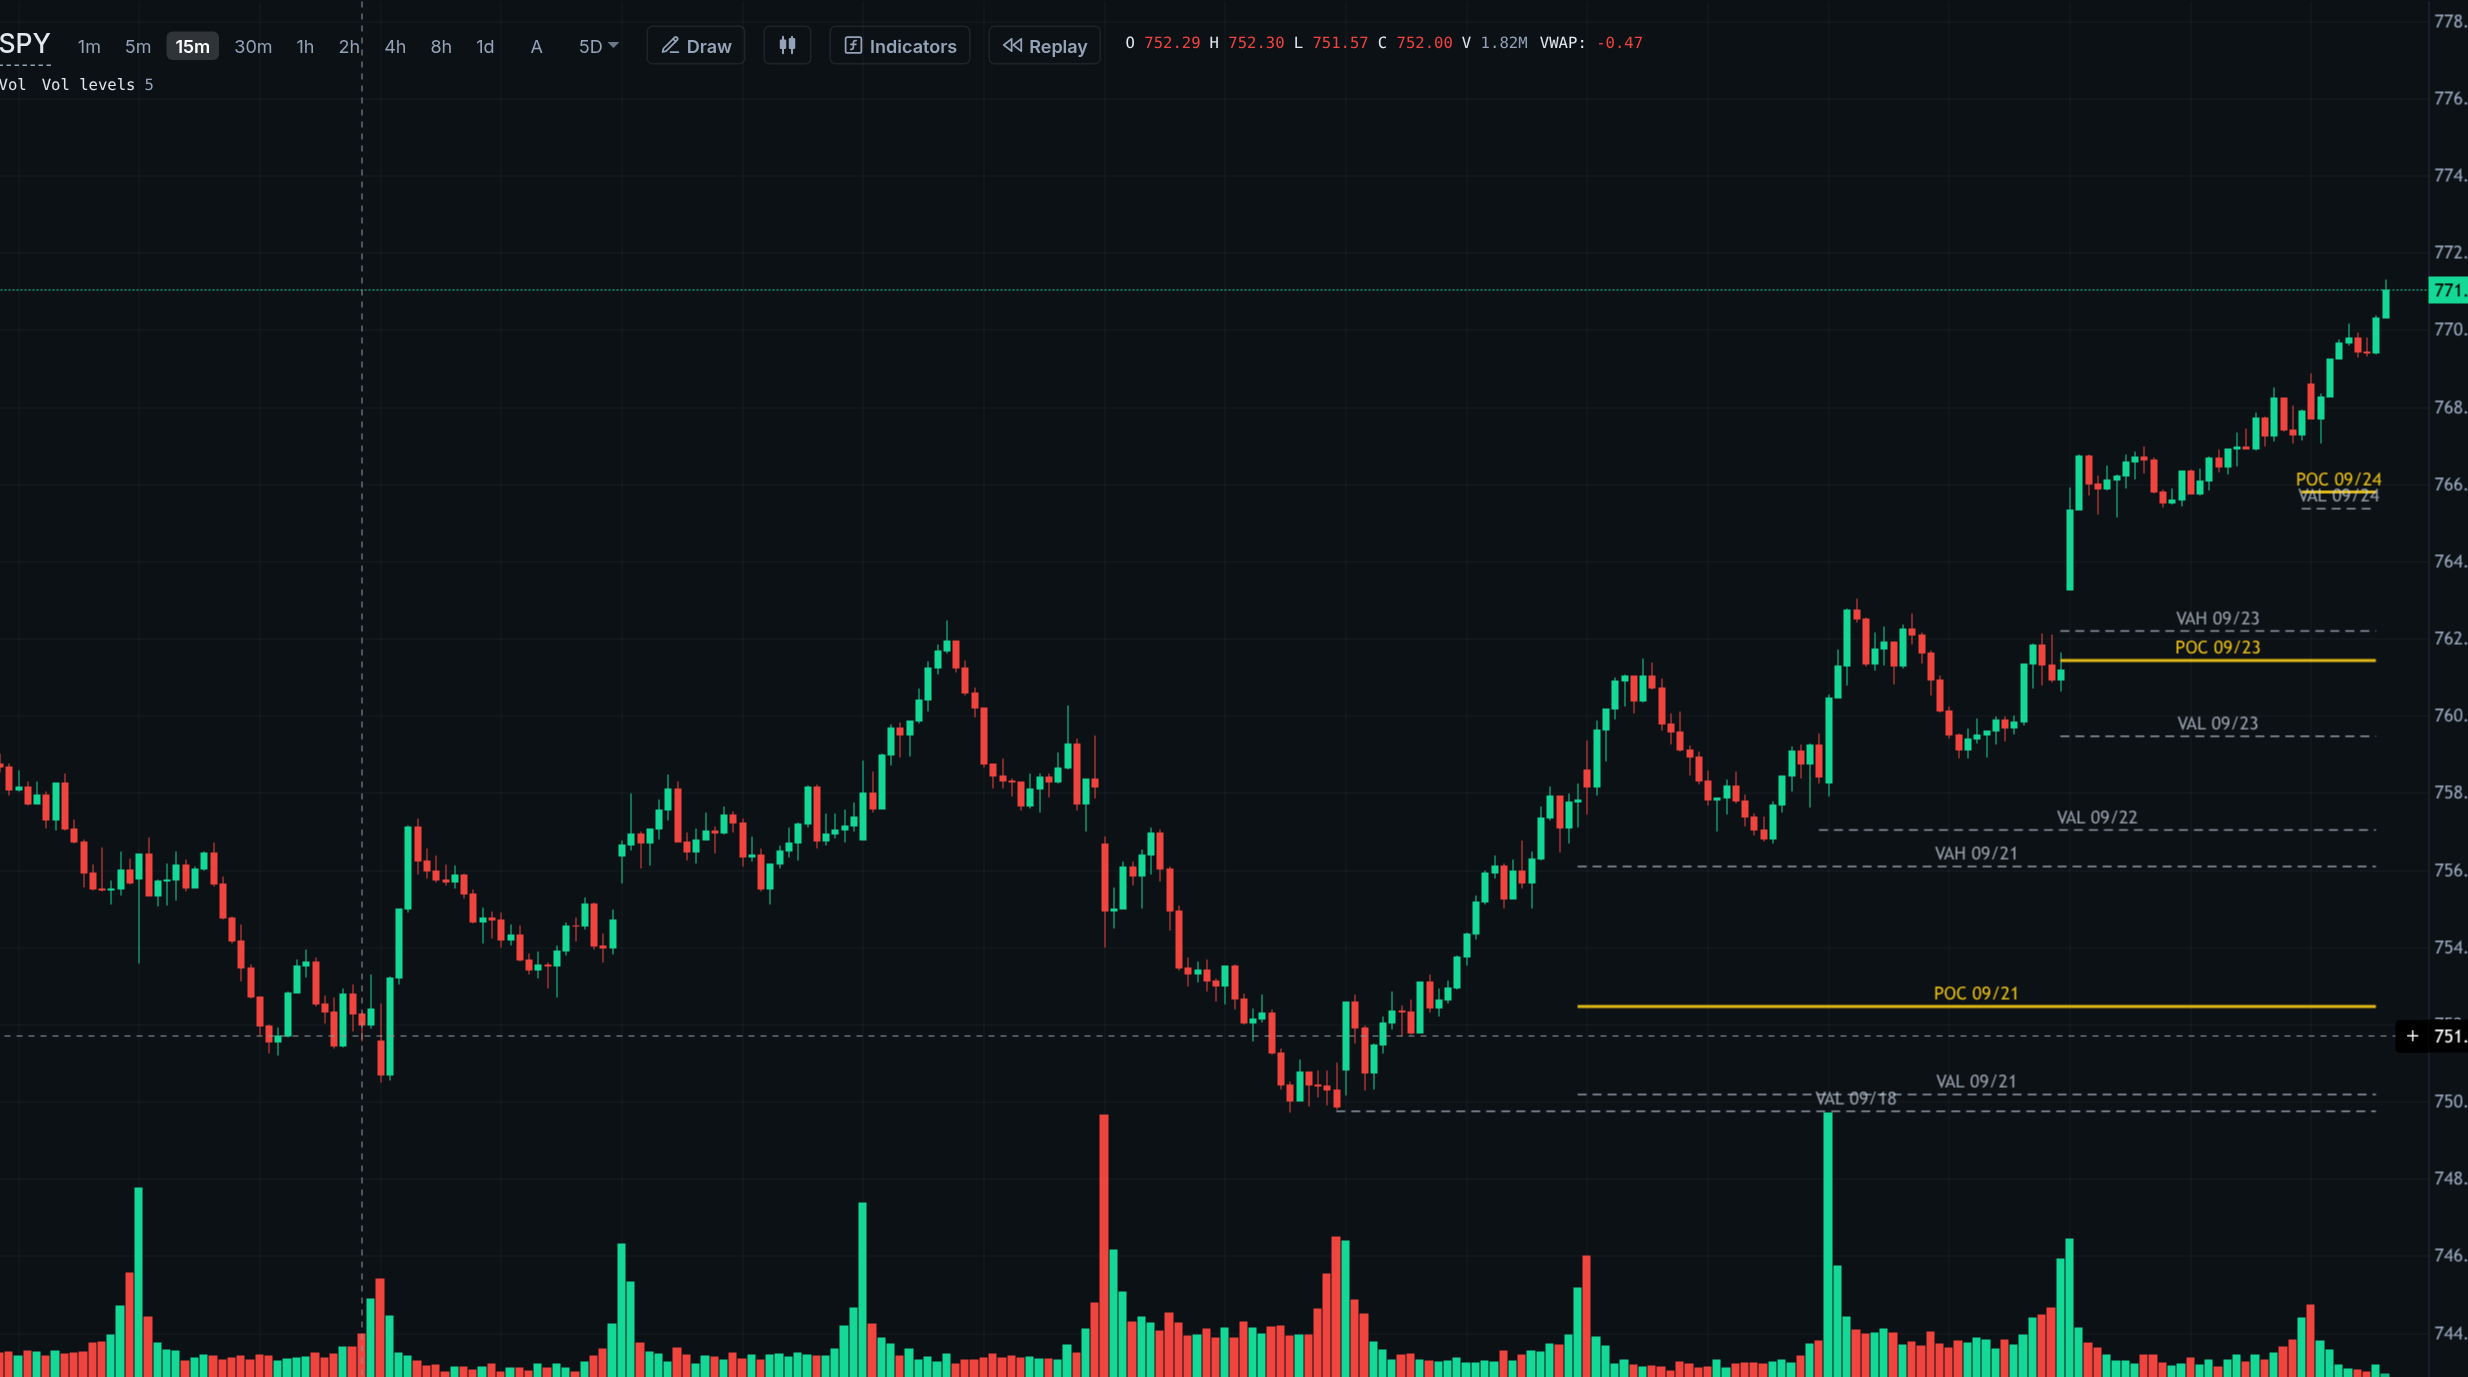
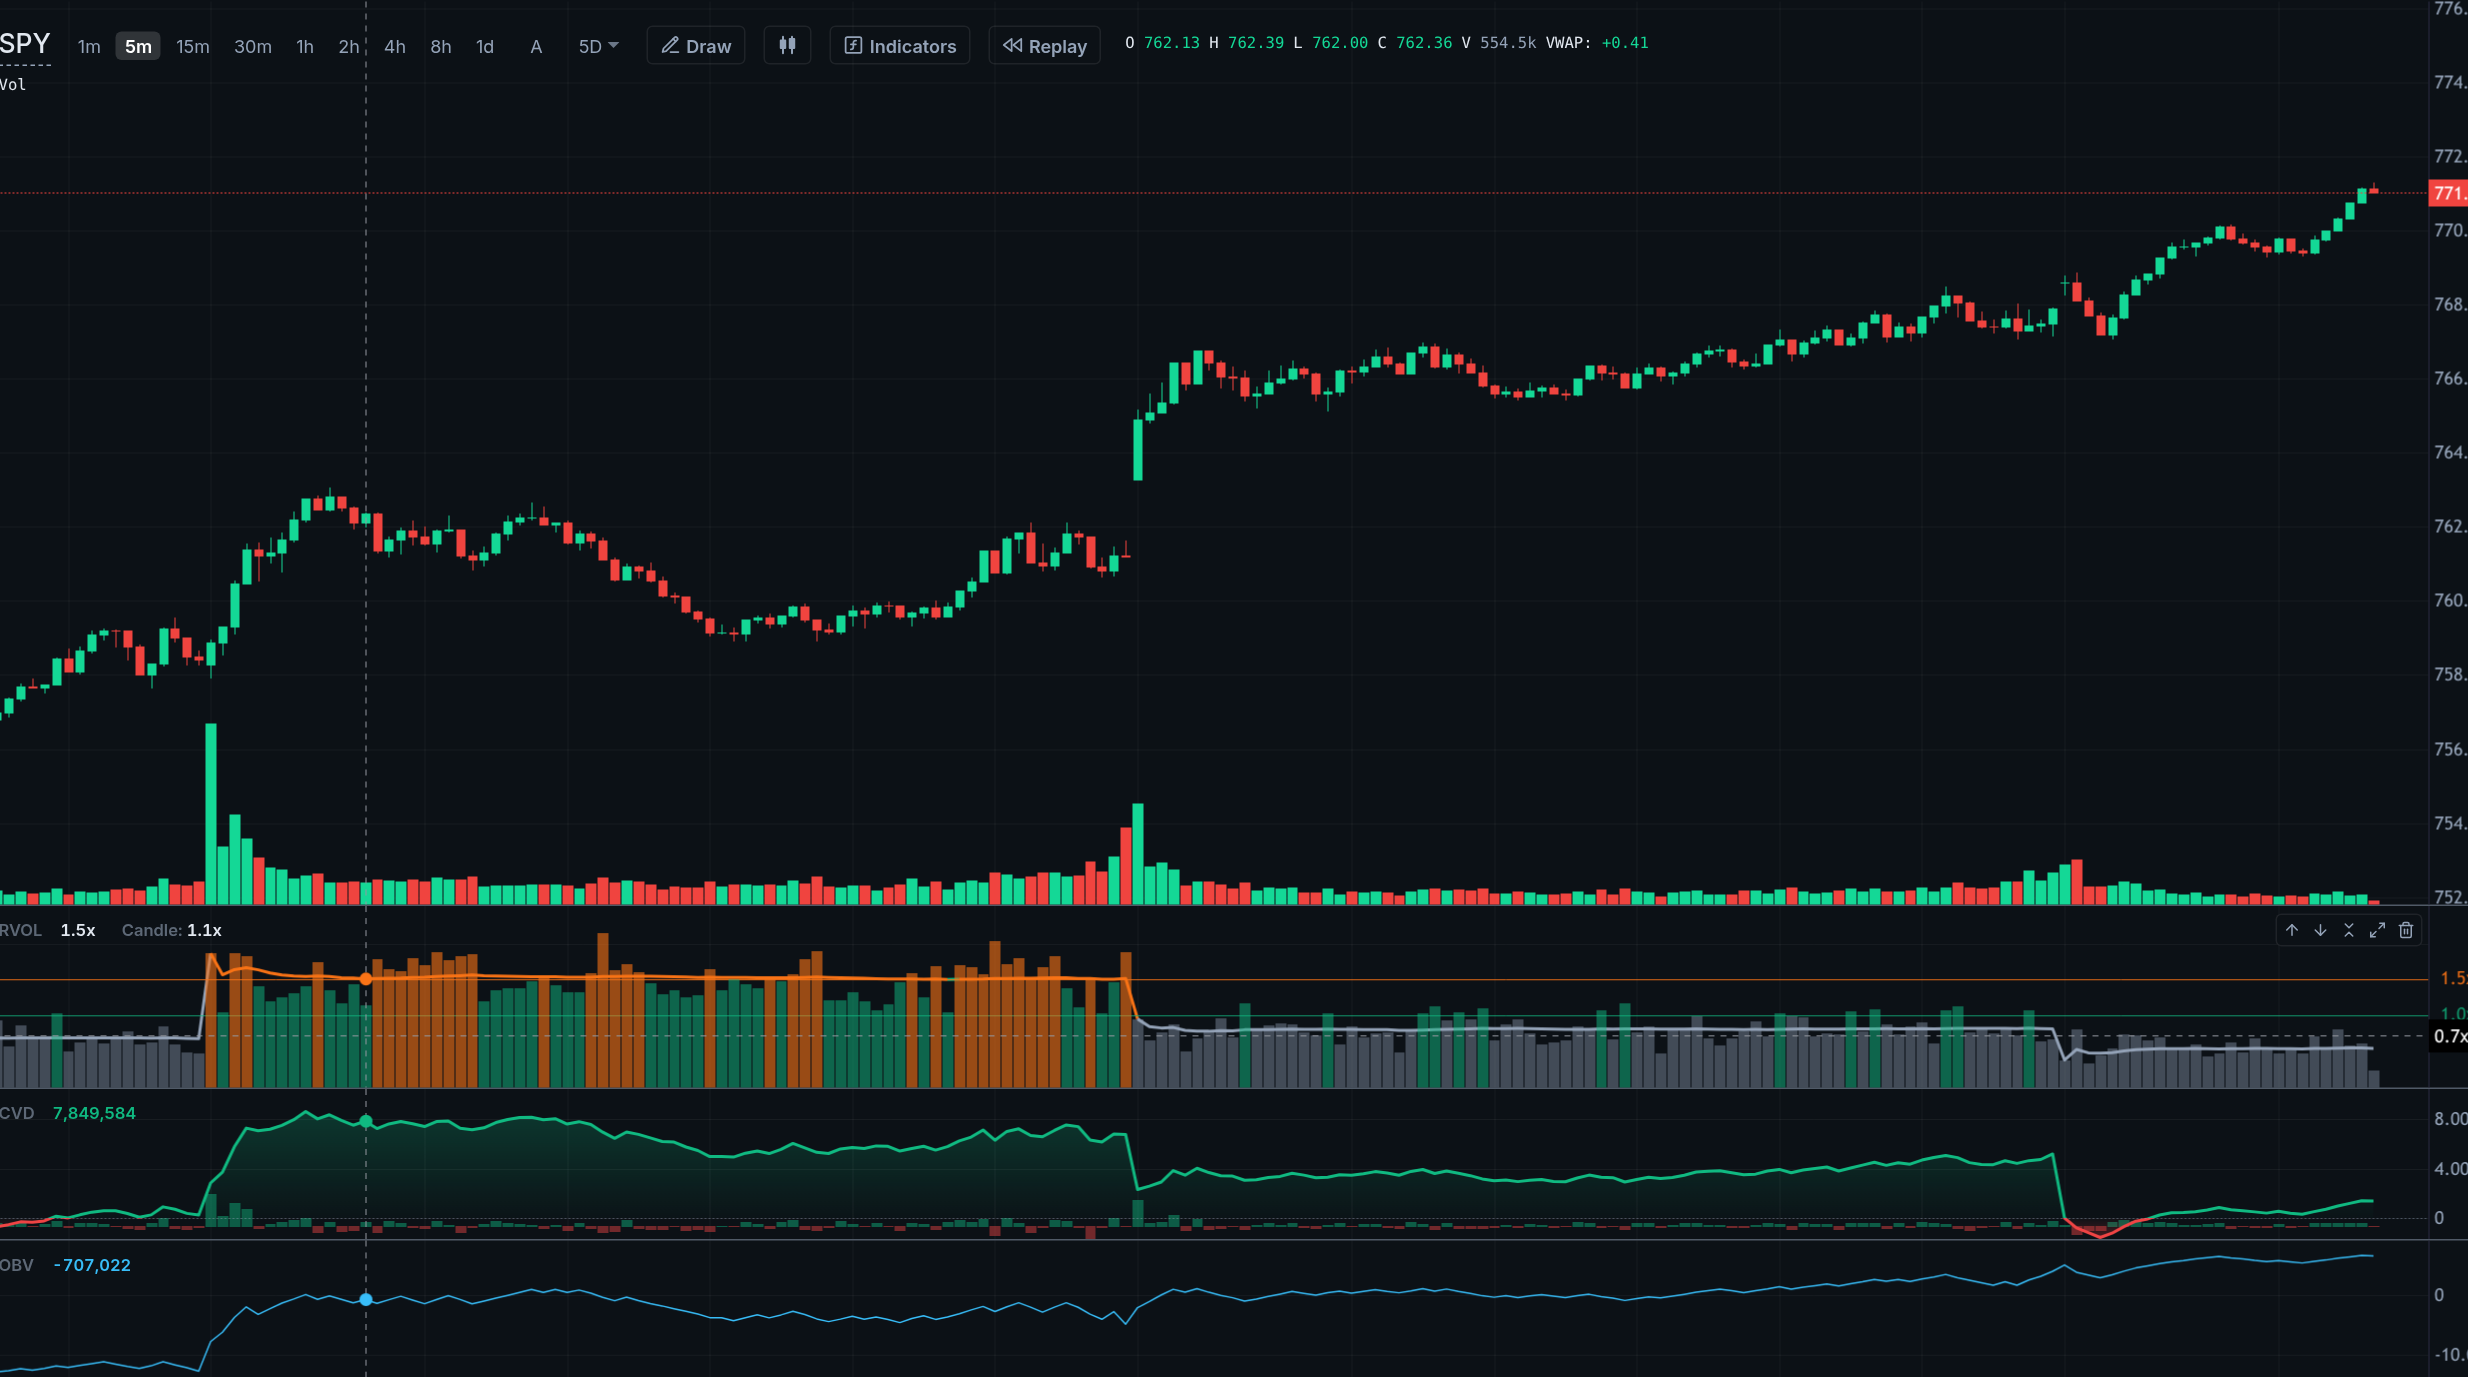
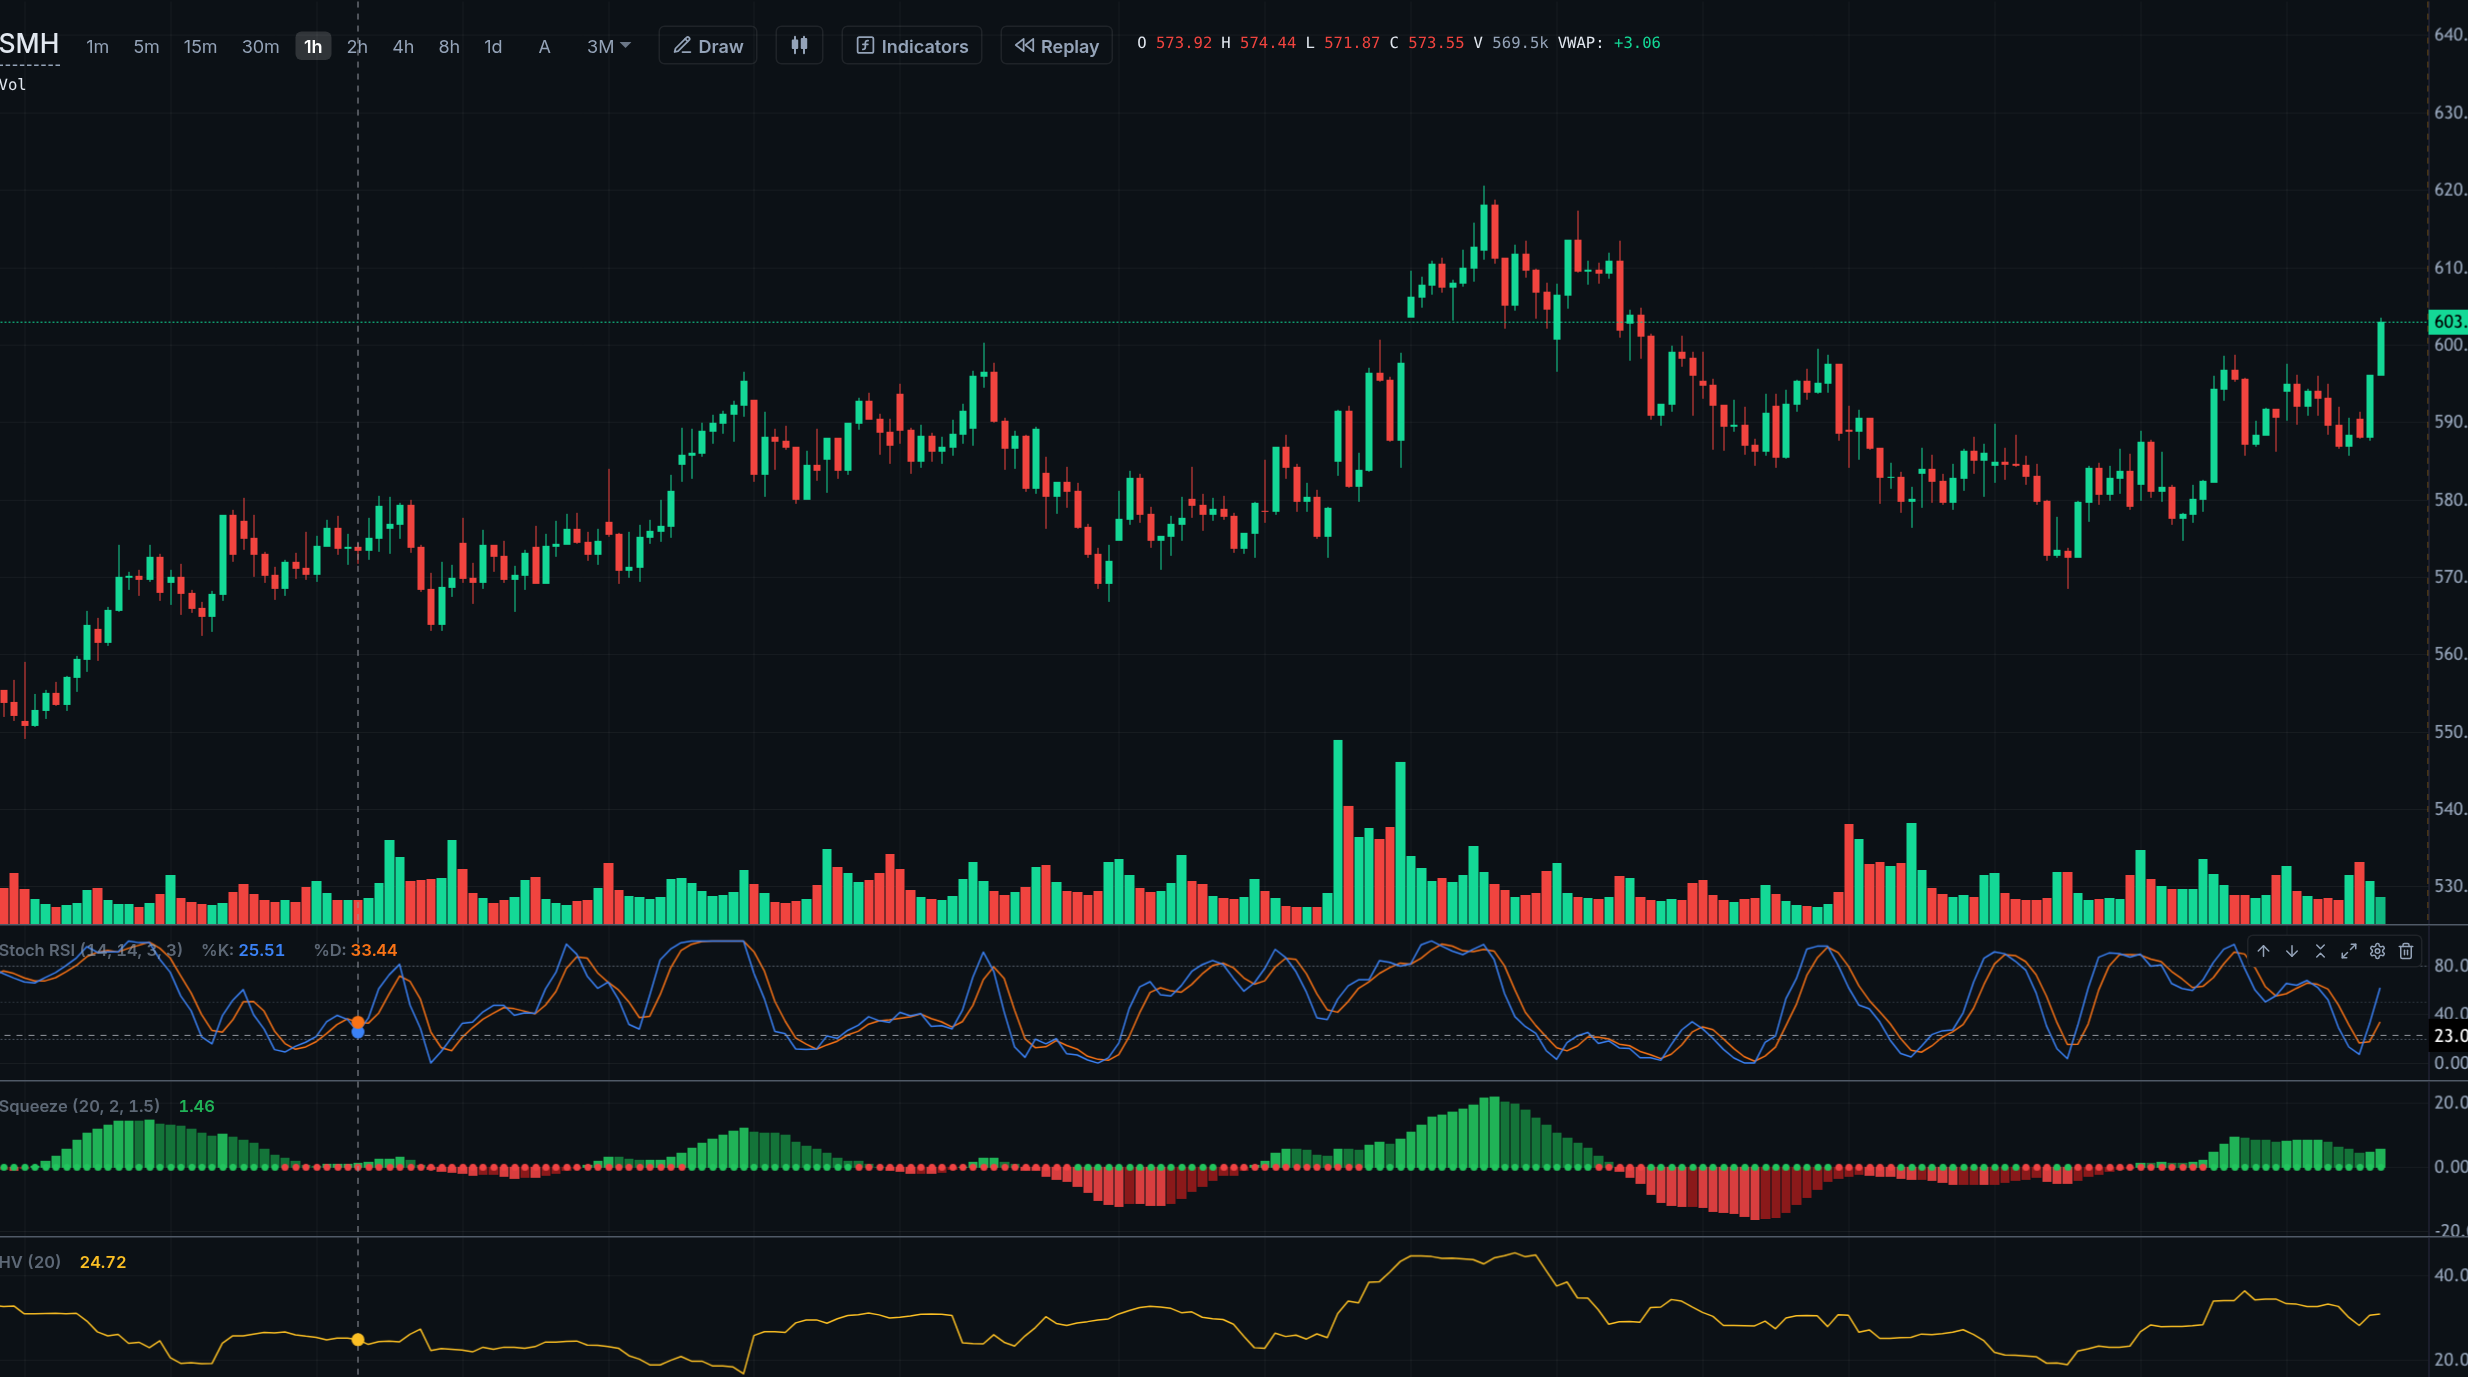
VWAP with bands, EMAs, prior-day and opening-range levels, pivots and volume profiles to show where price is trading during the session.
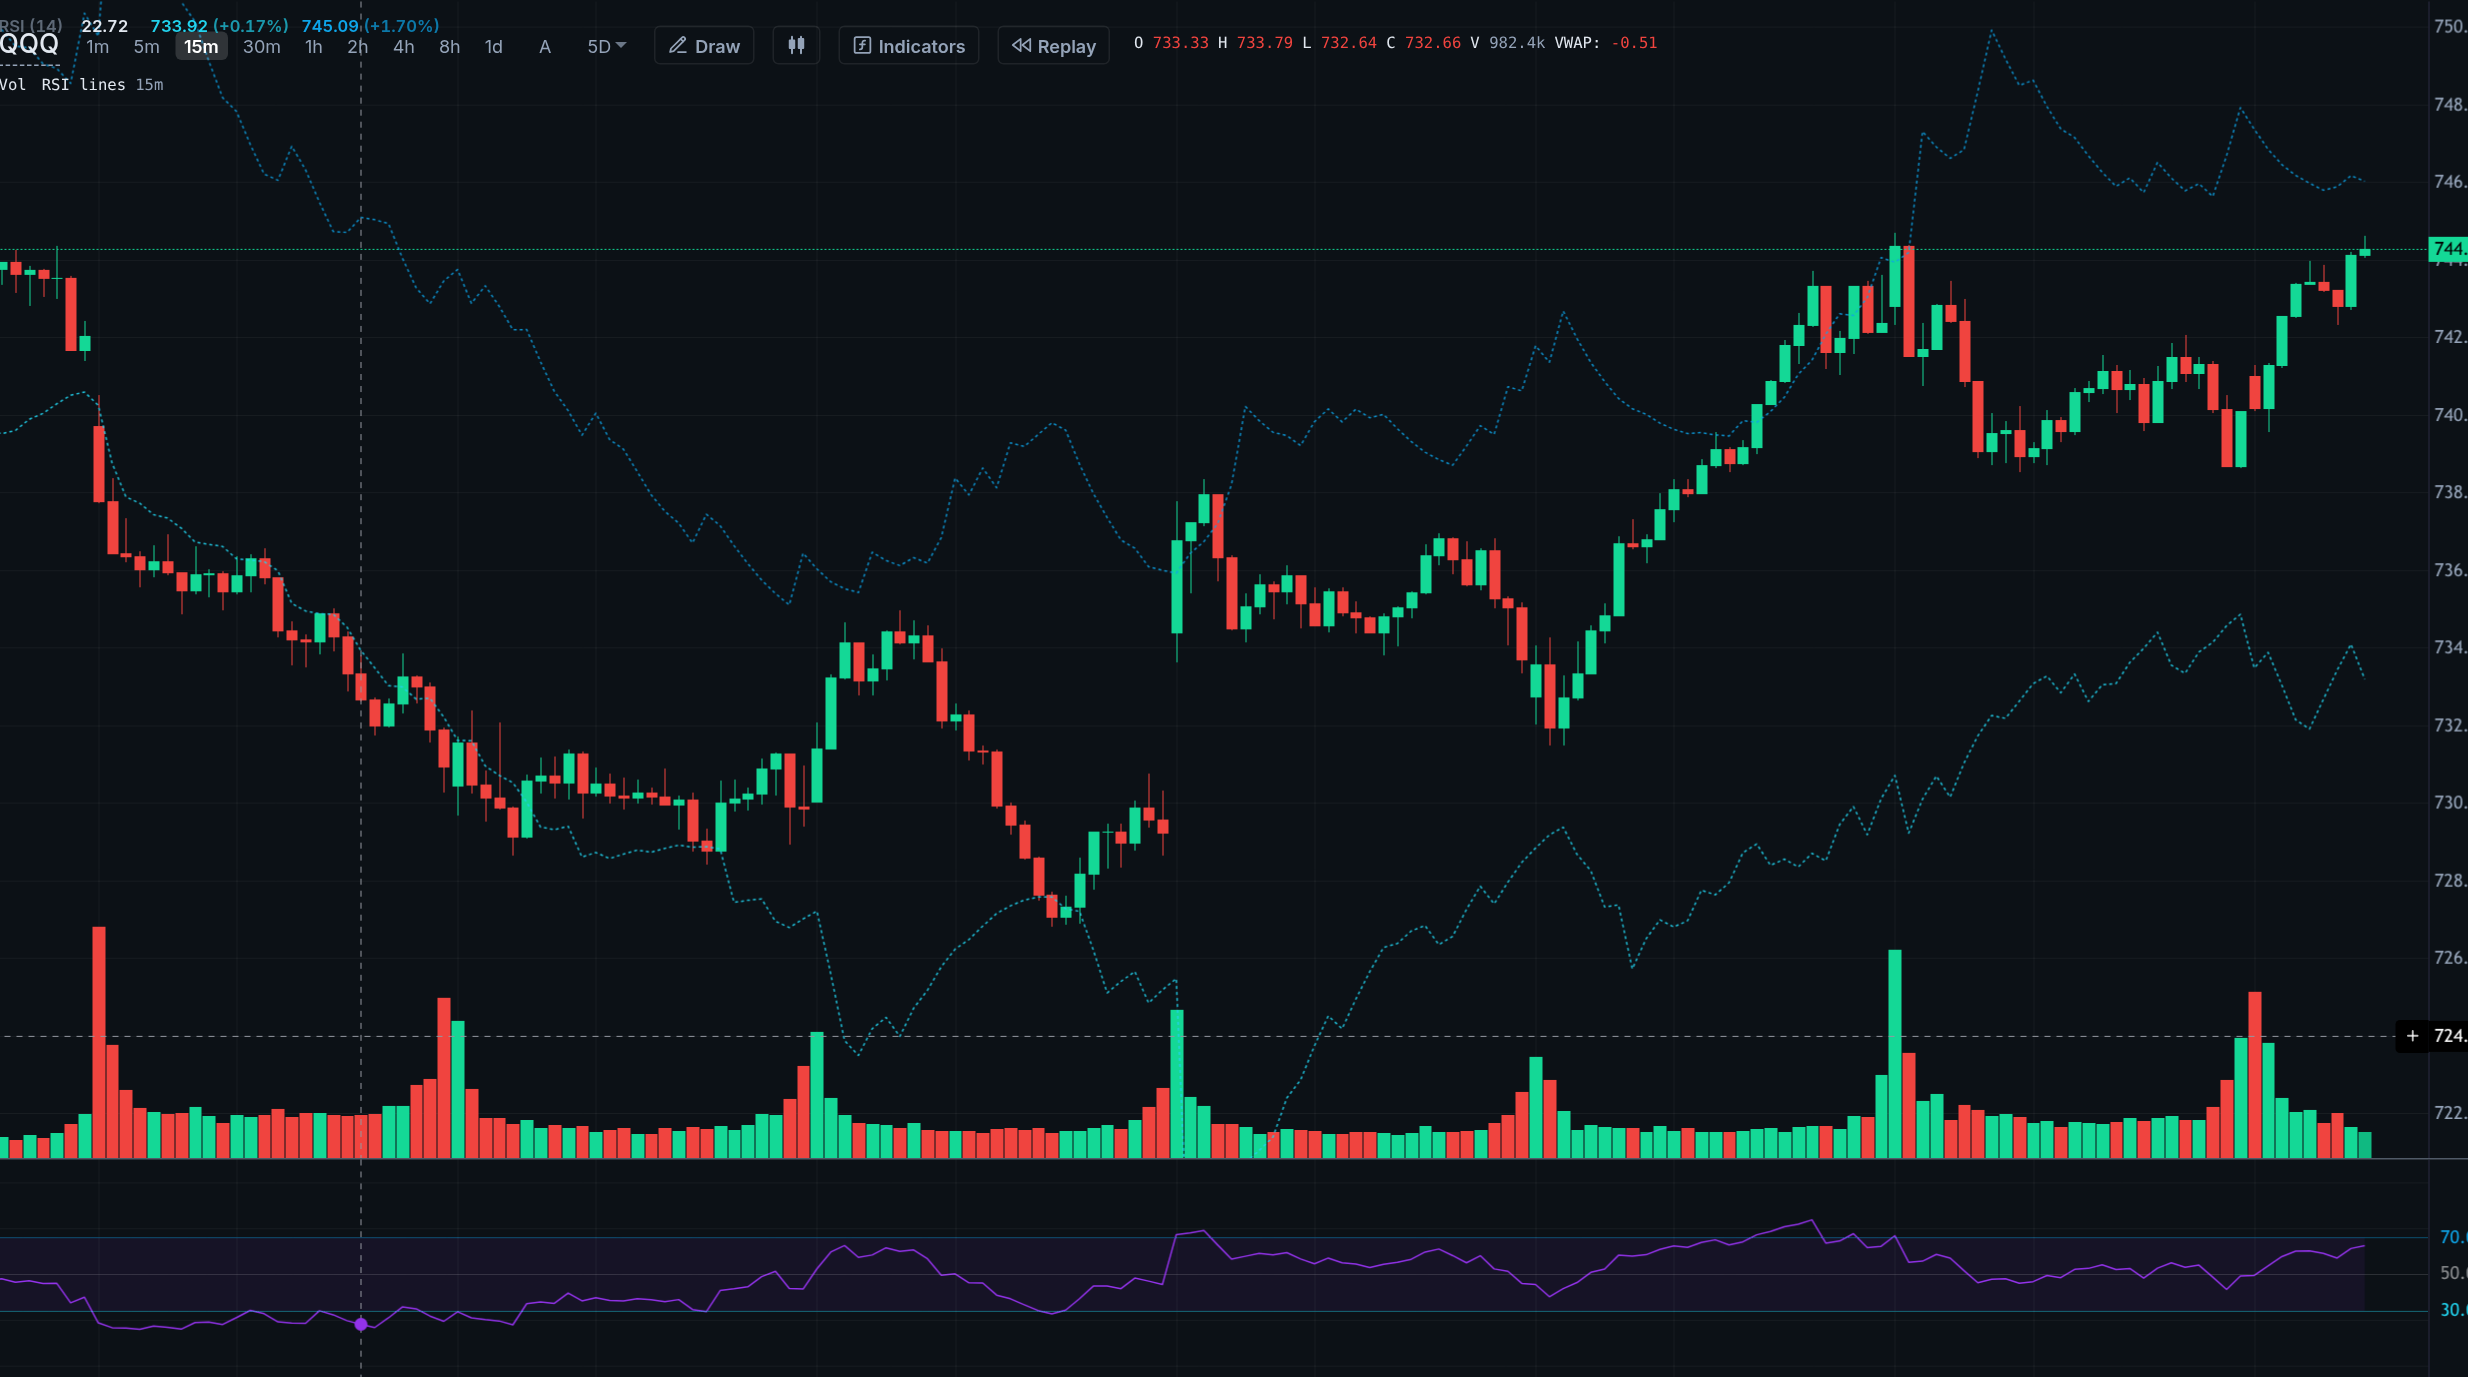
Averages, channels and trend lines
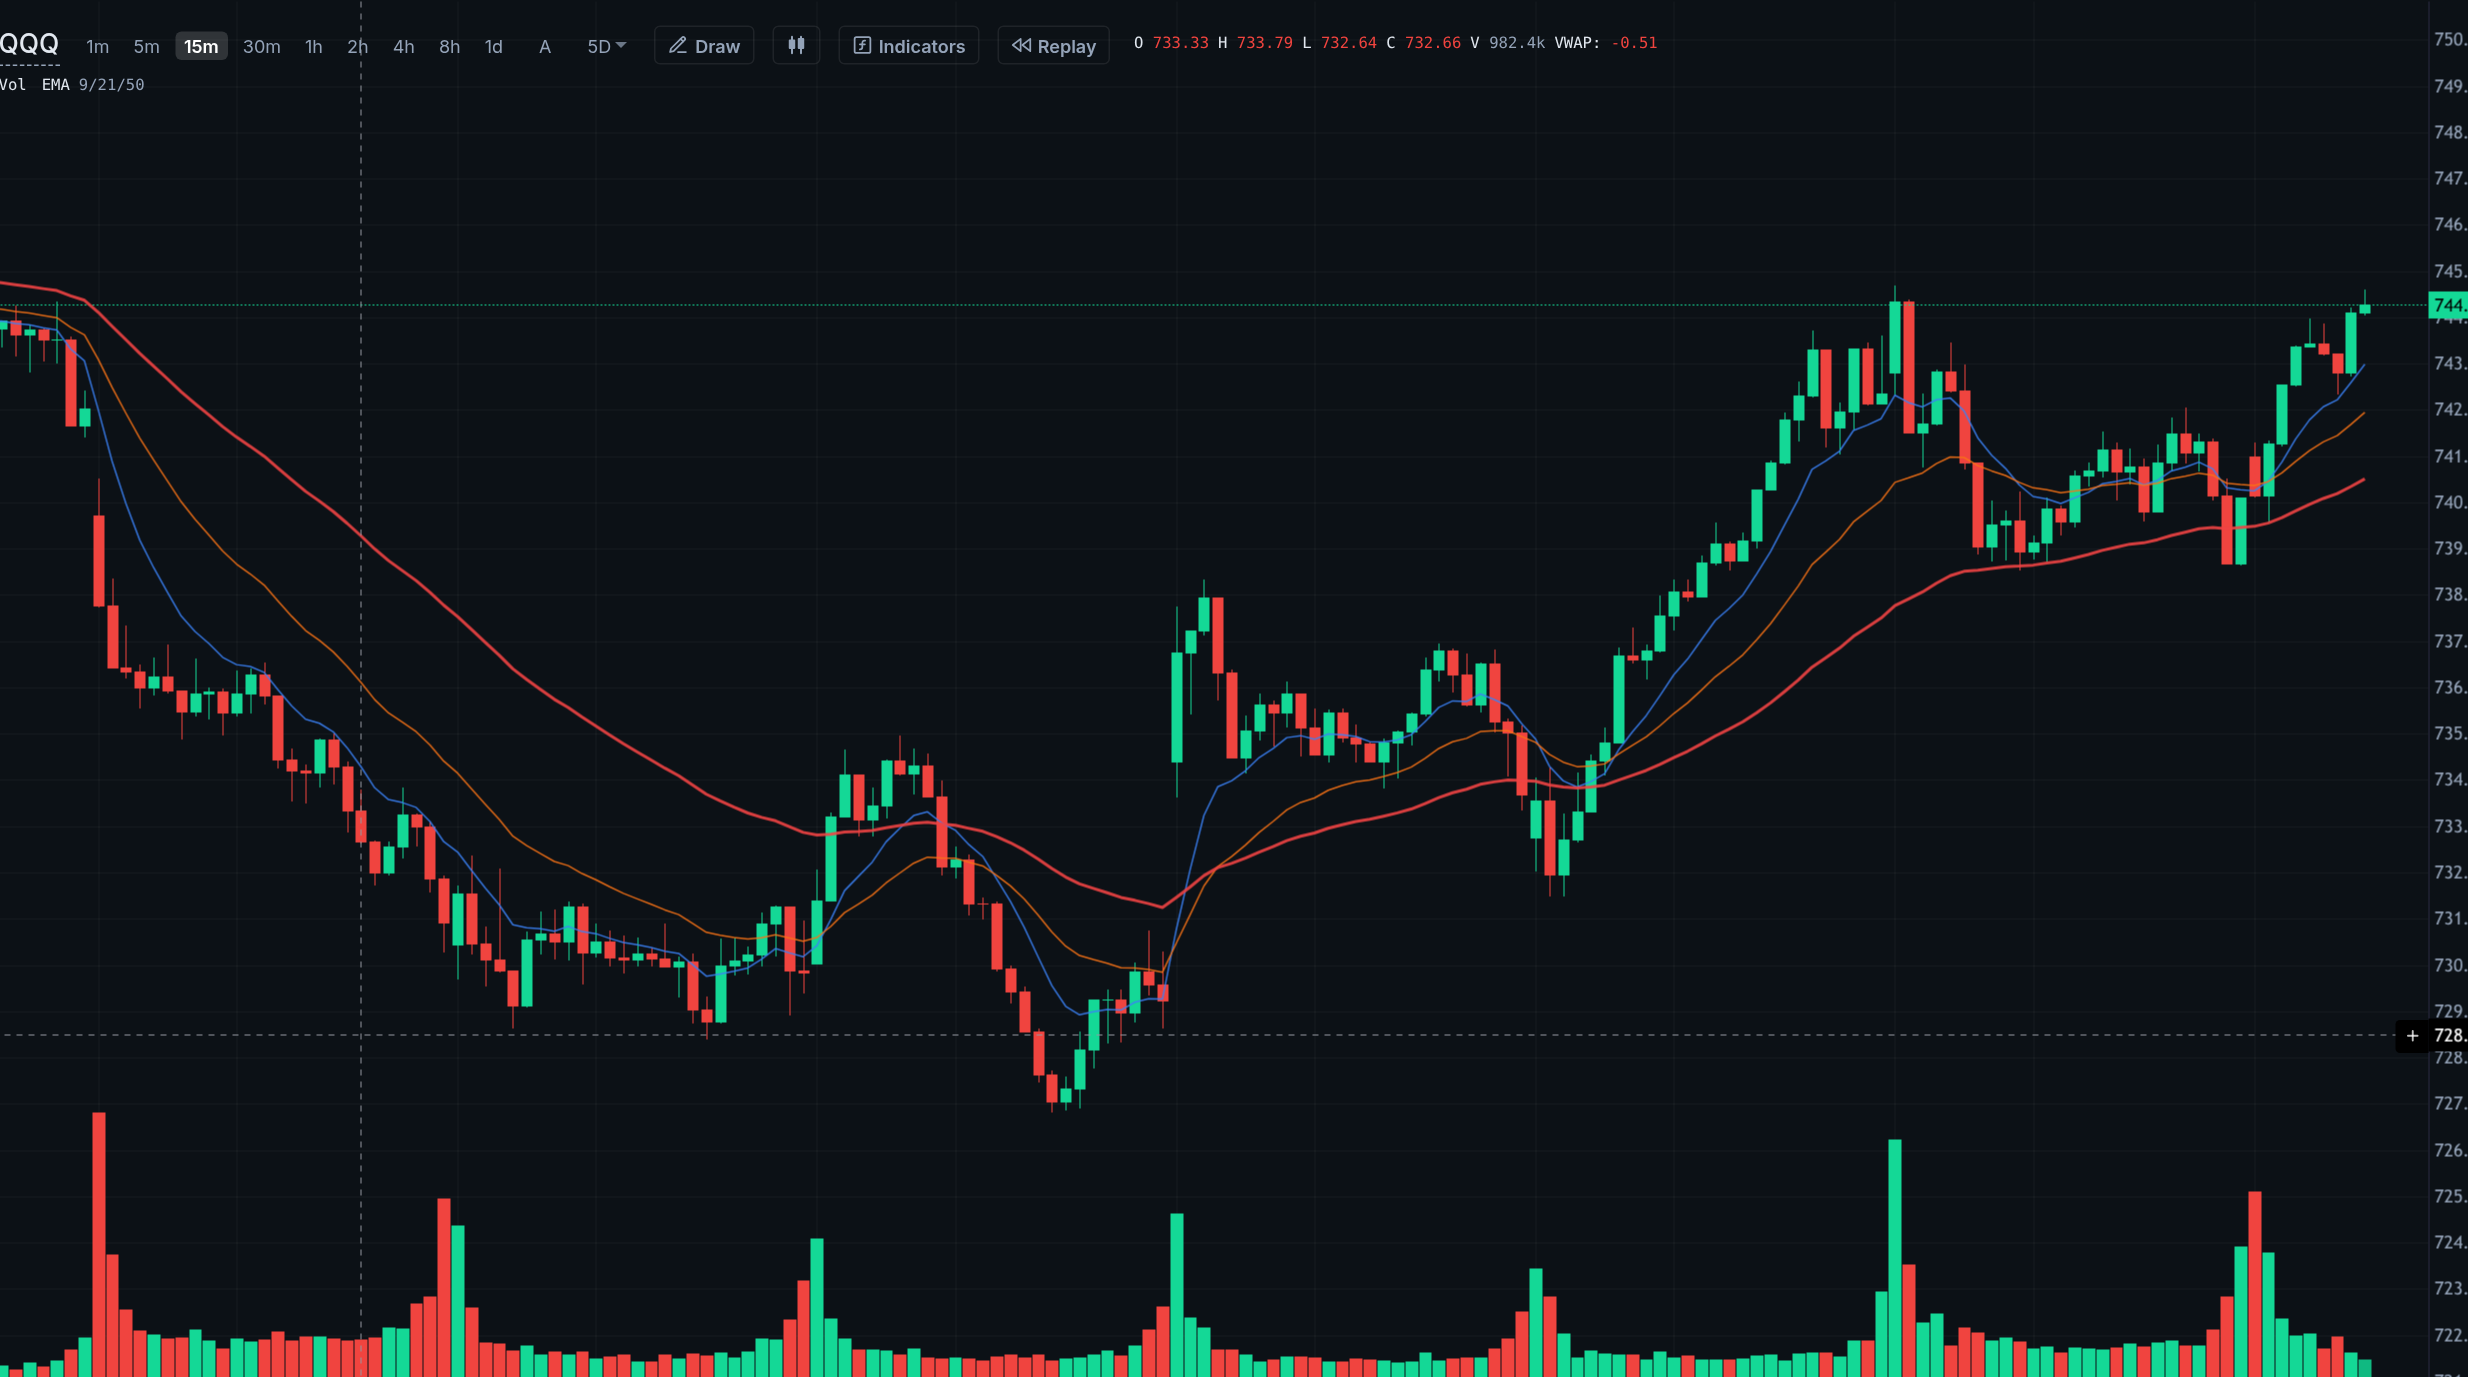
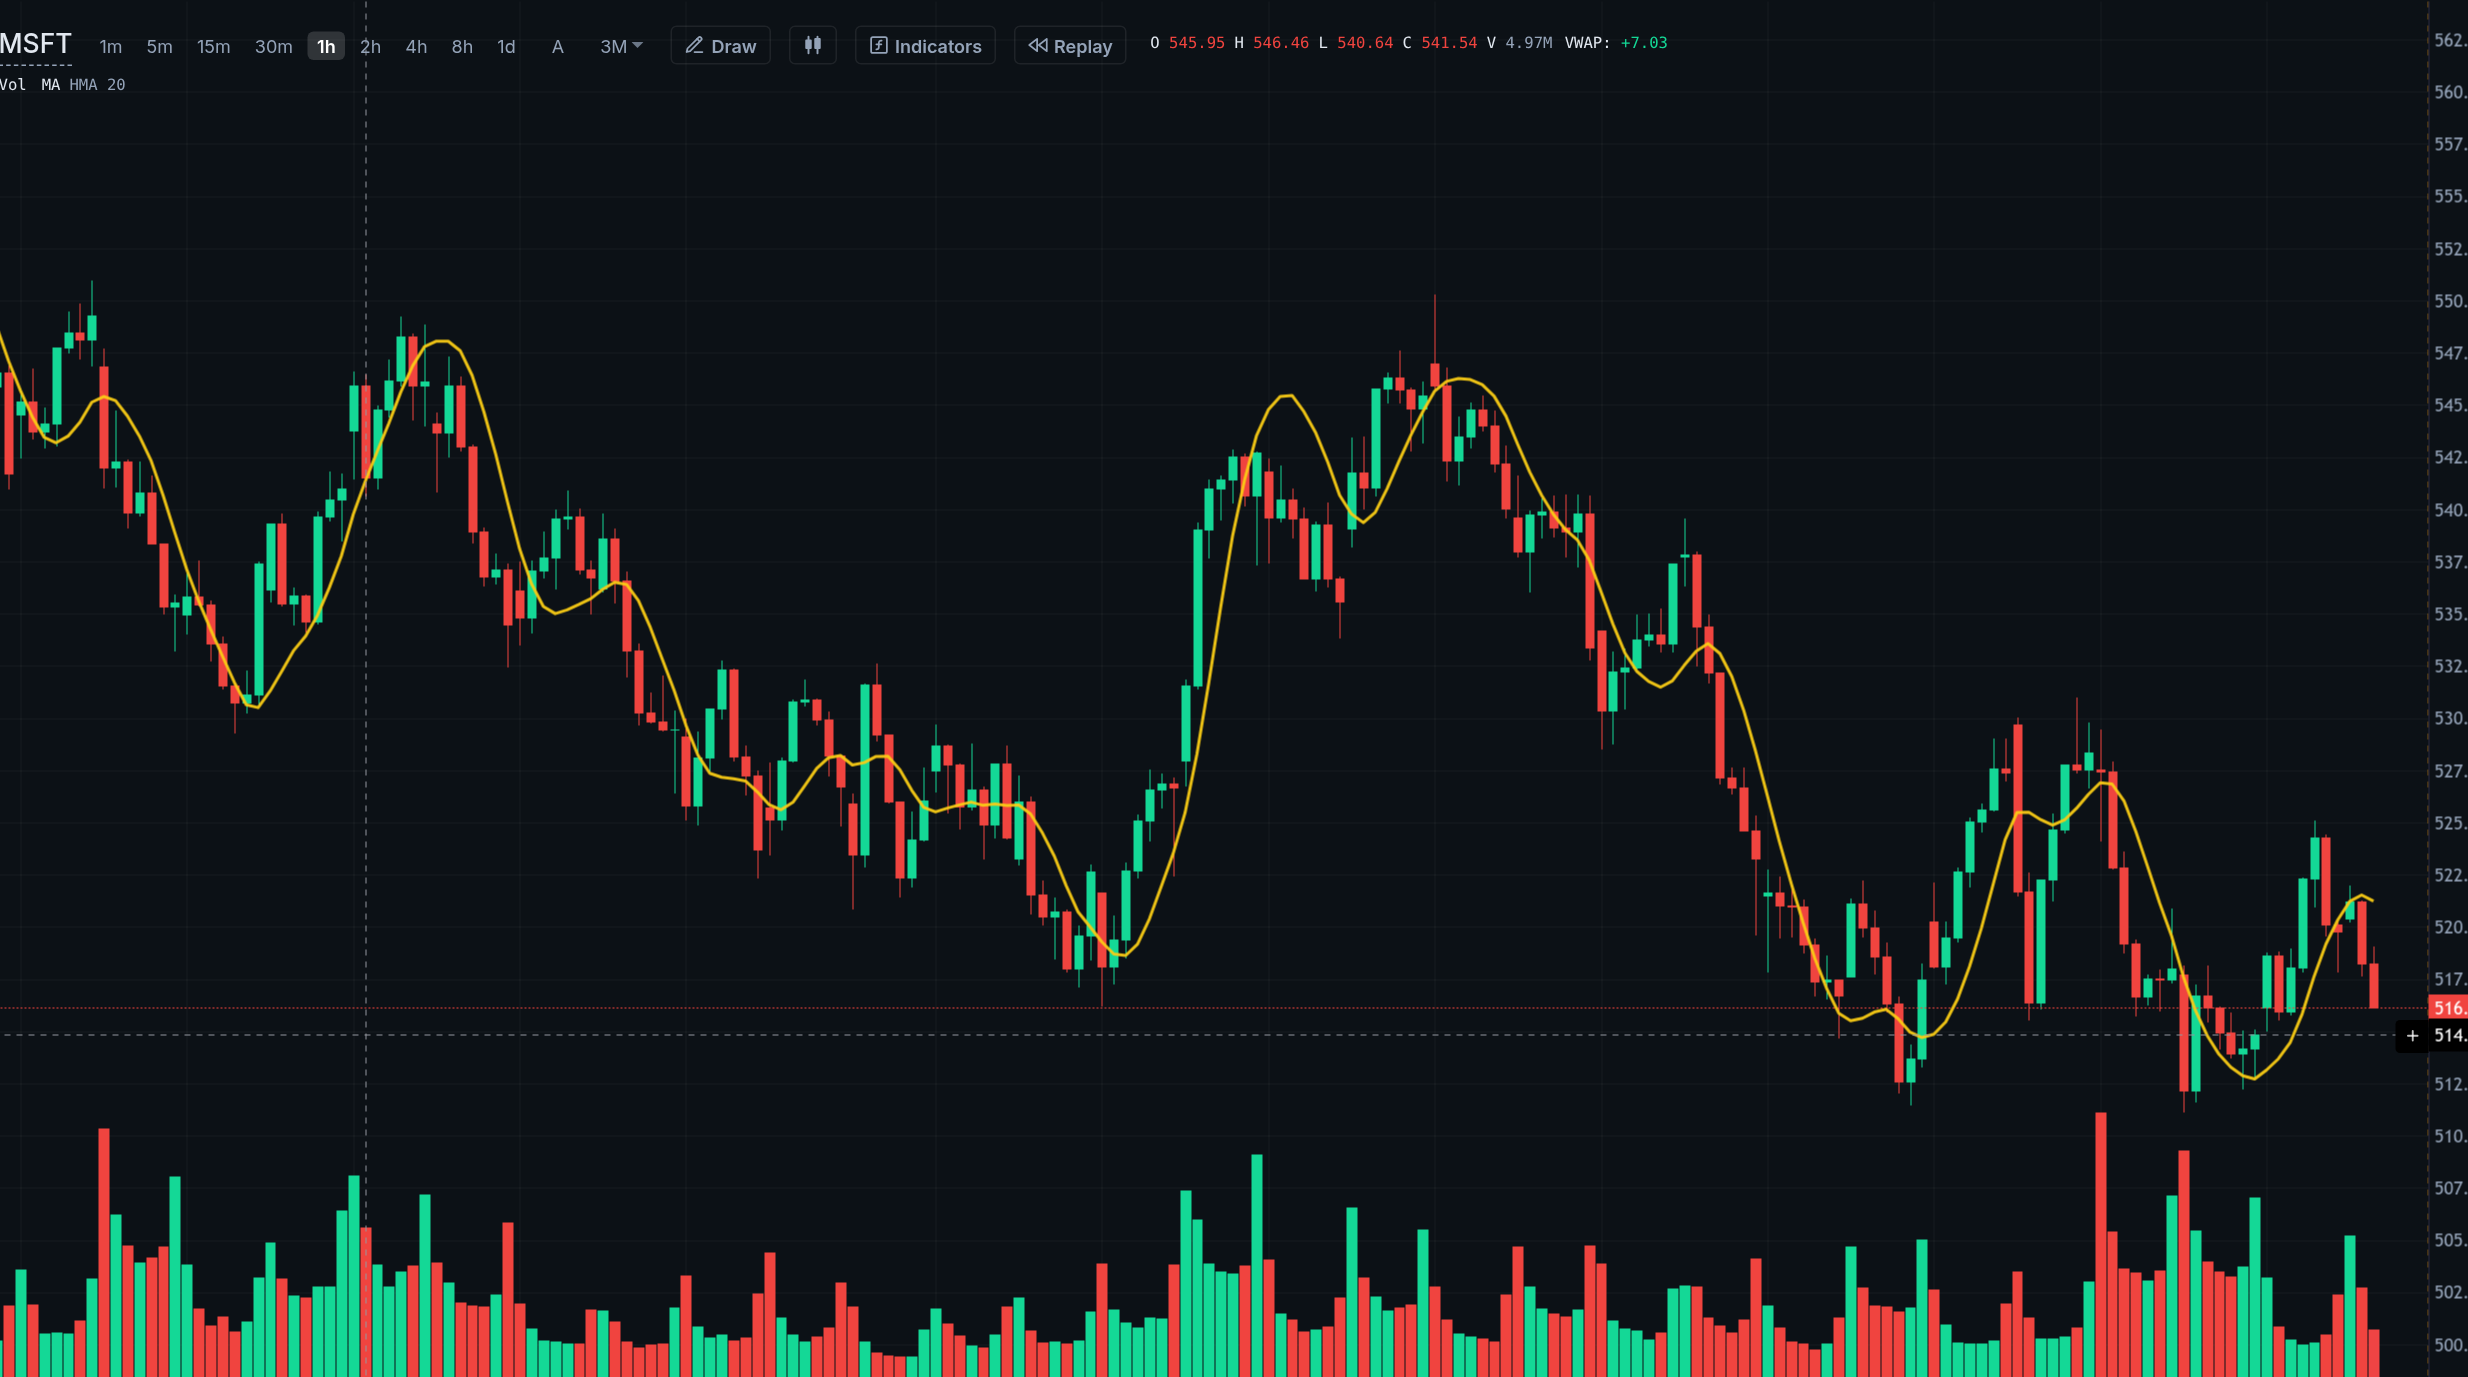
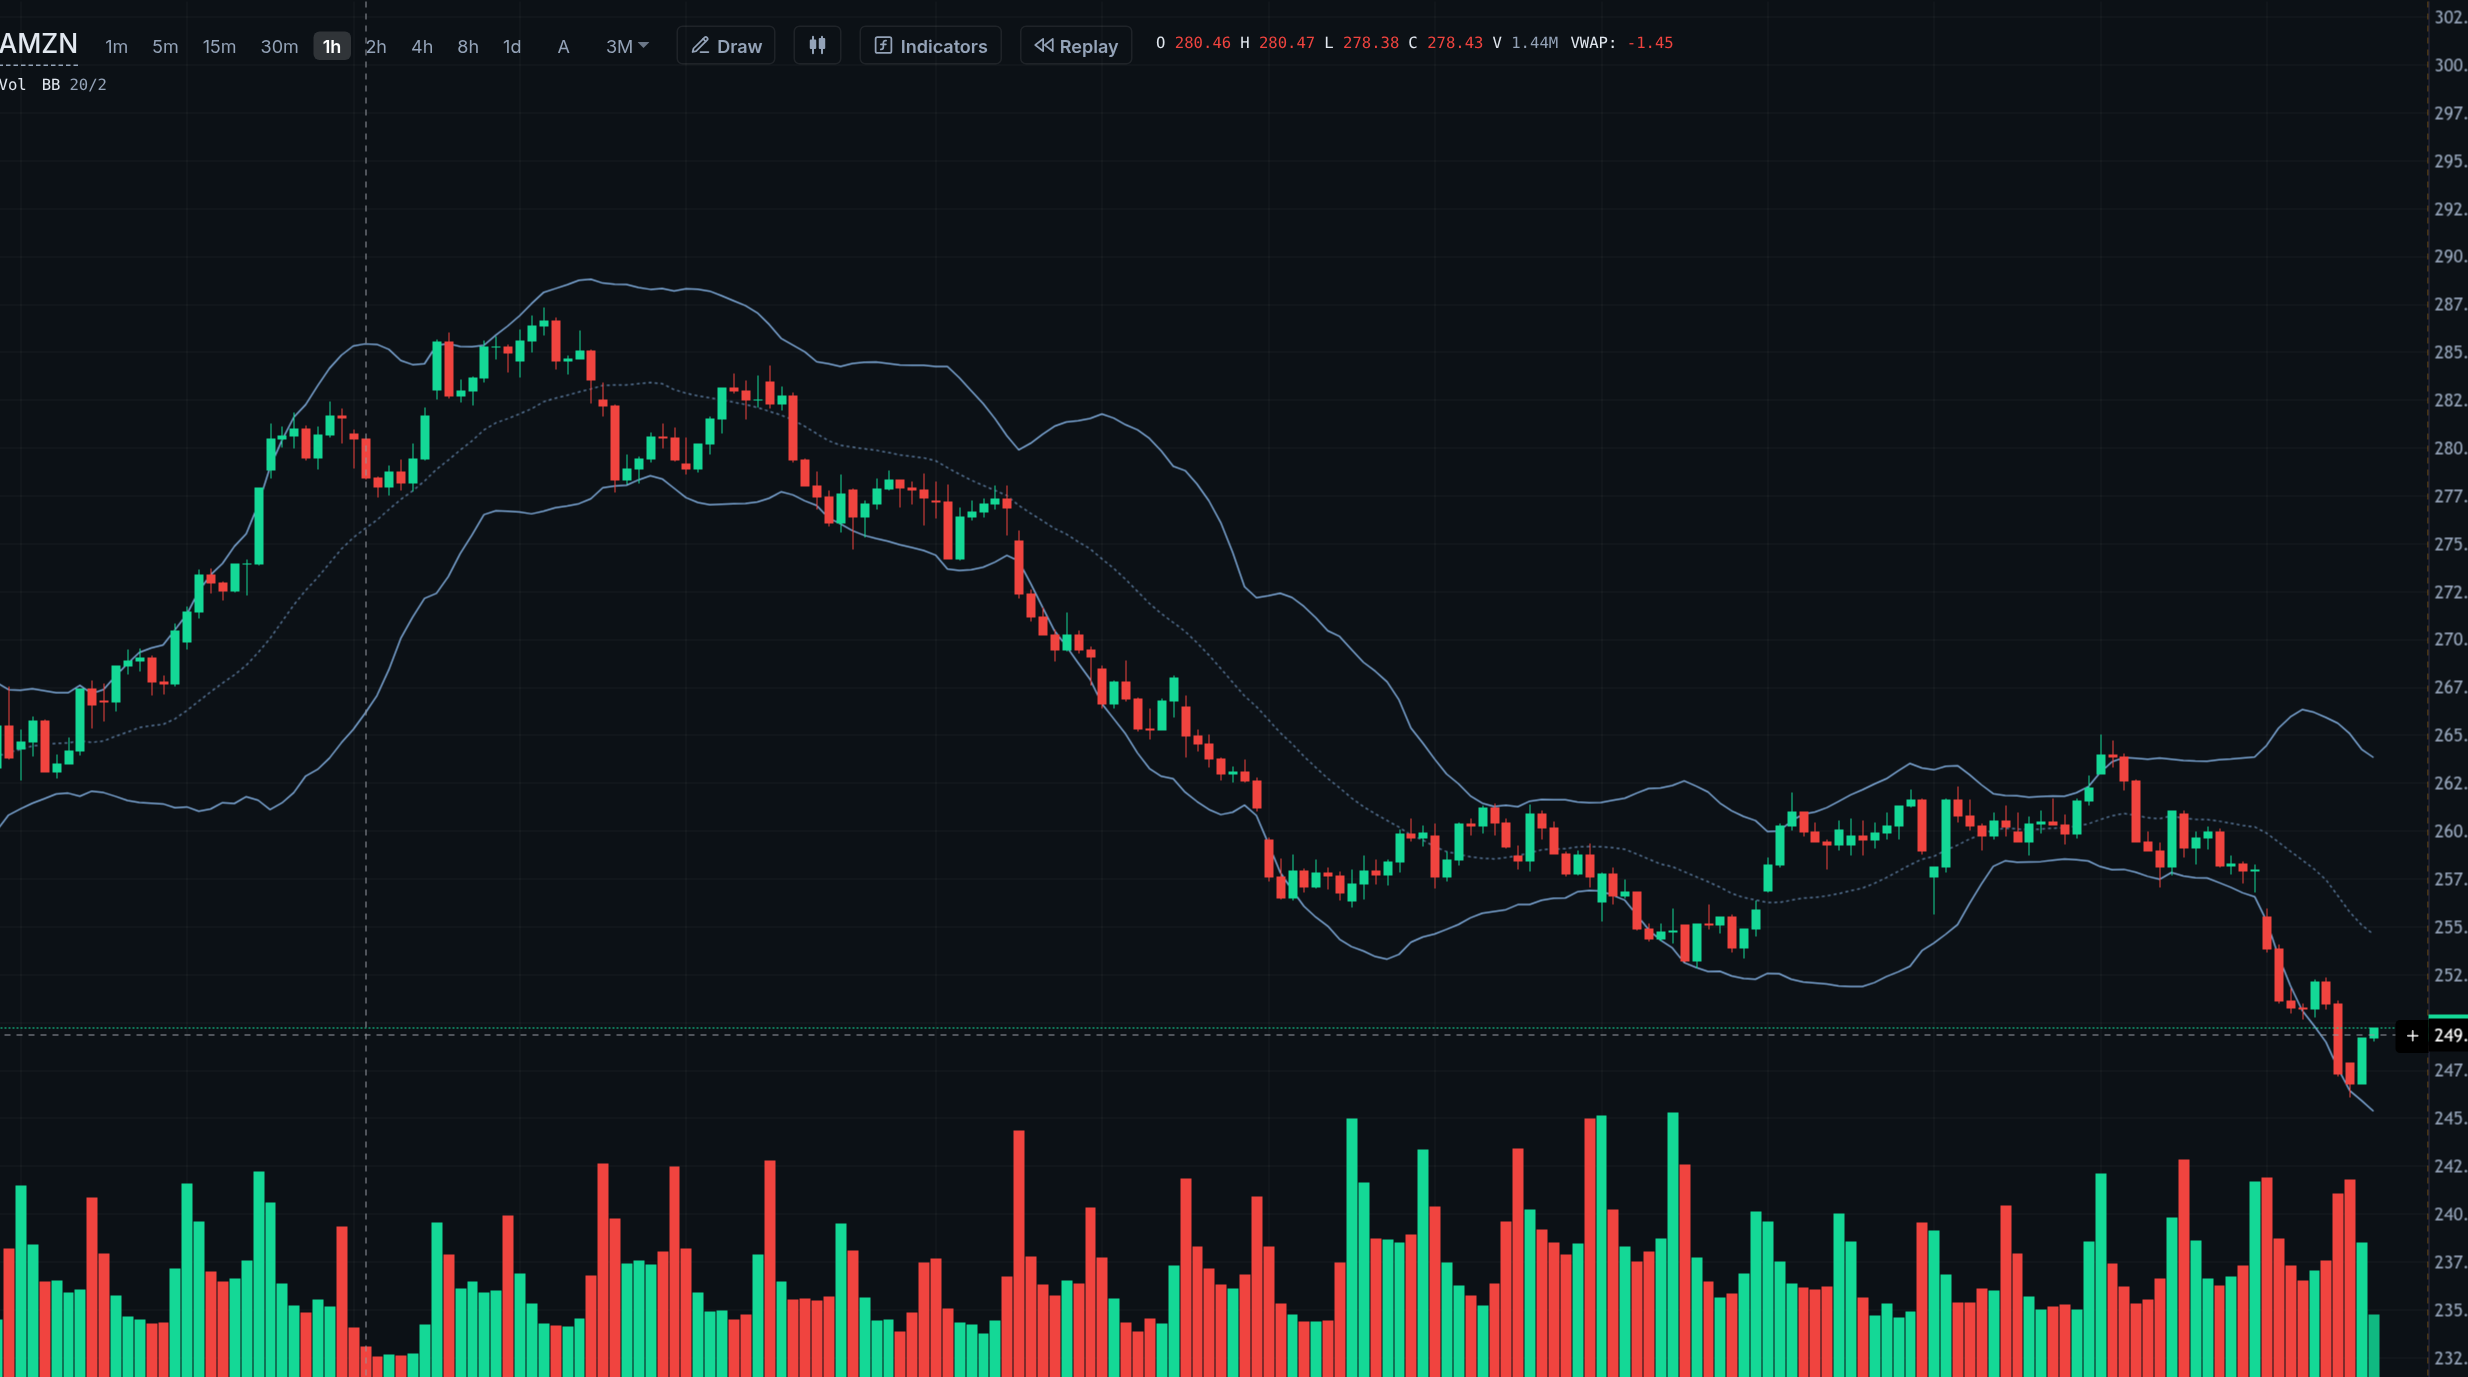
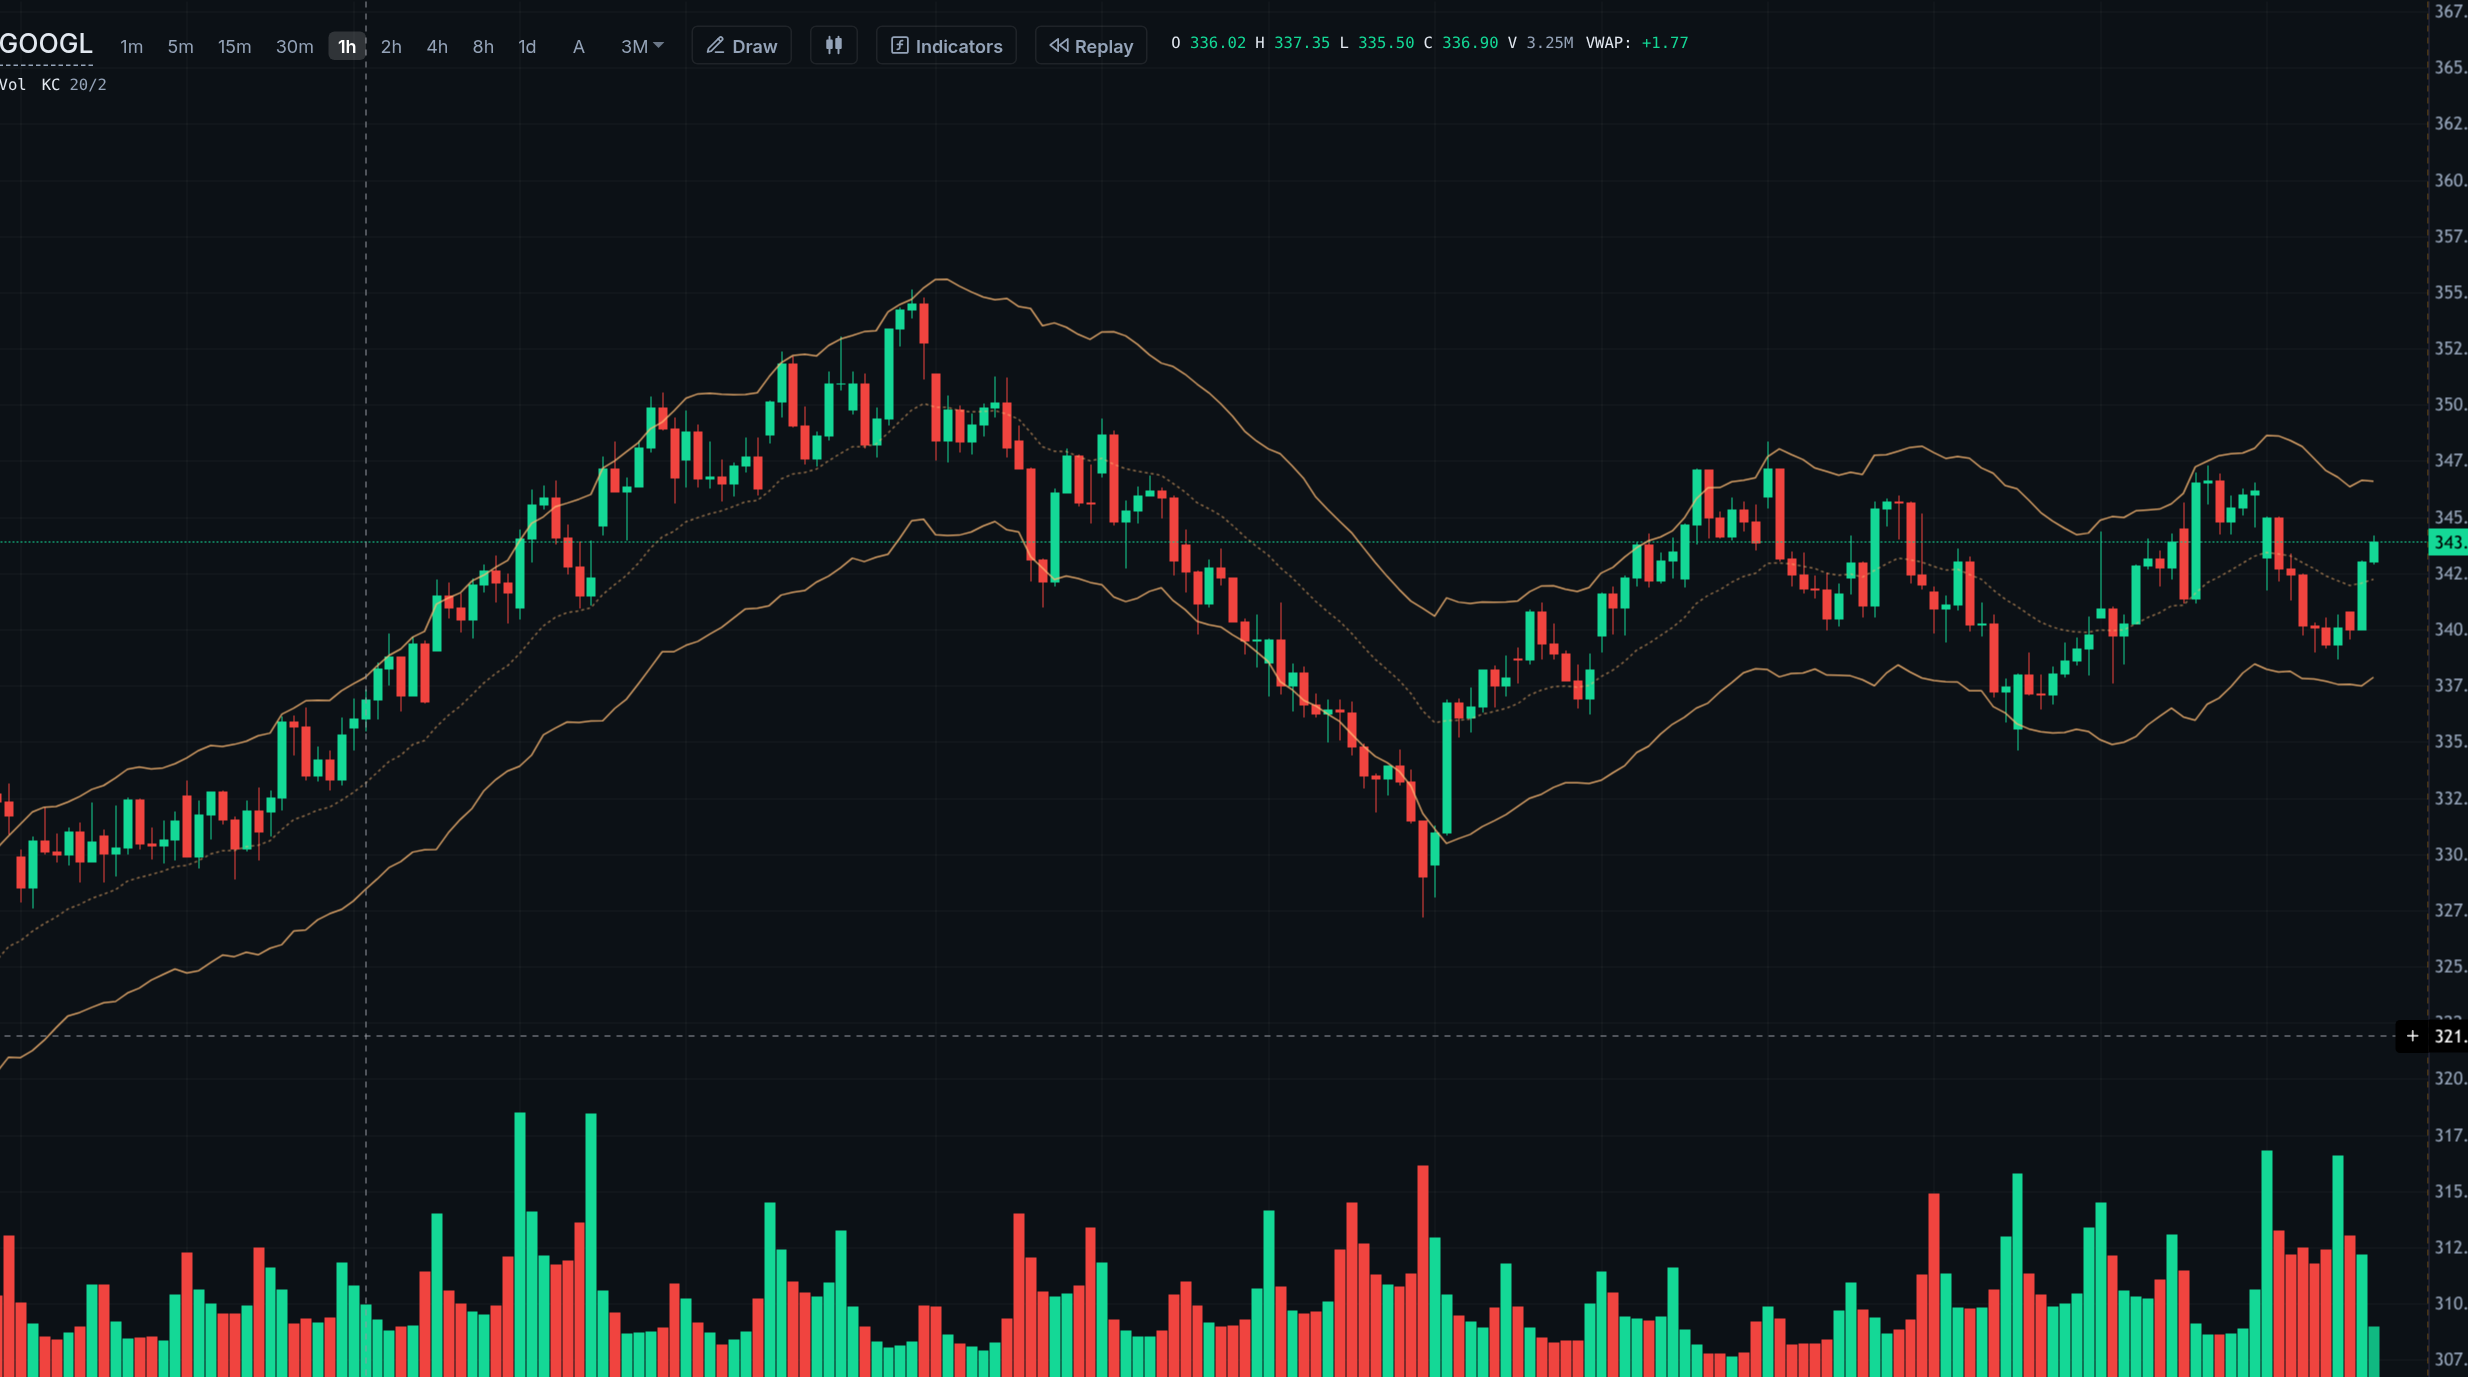
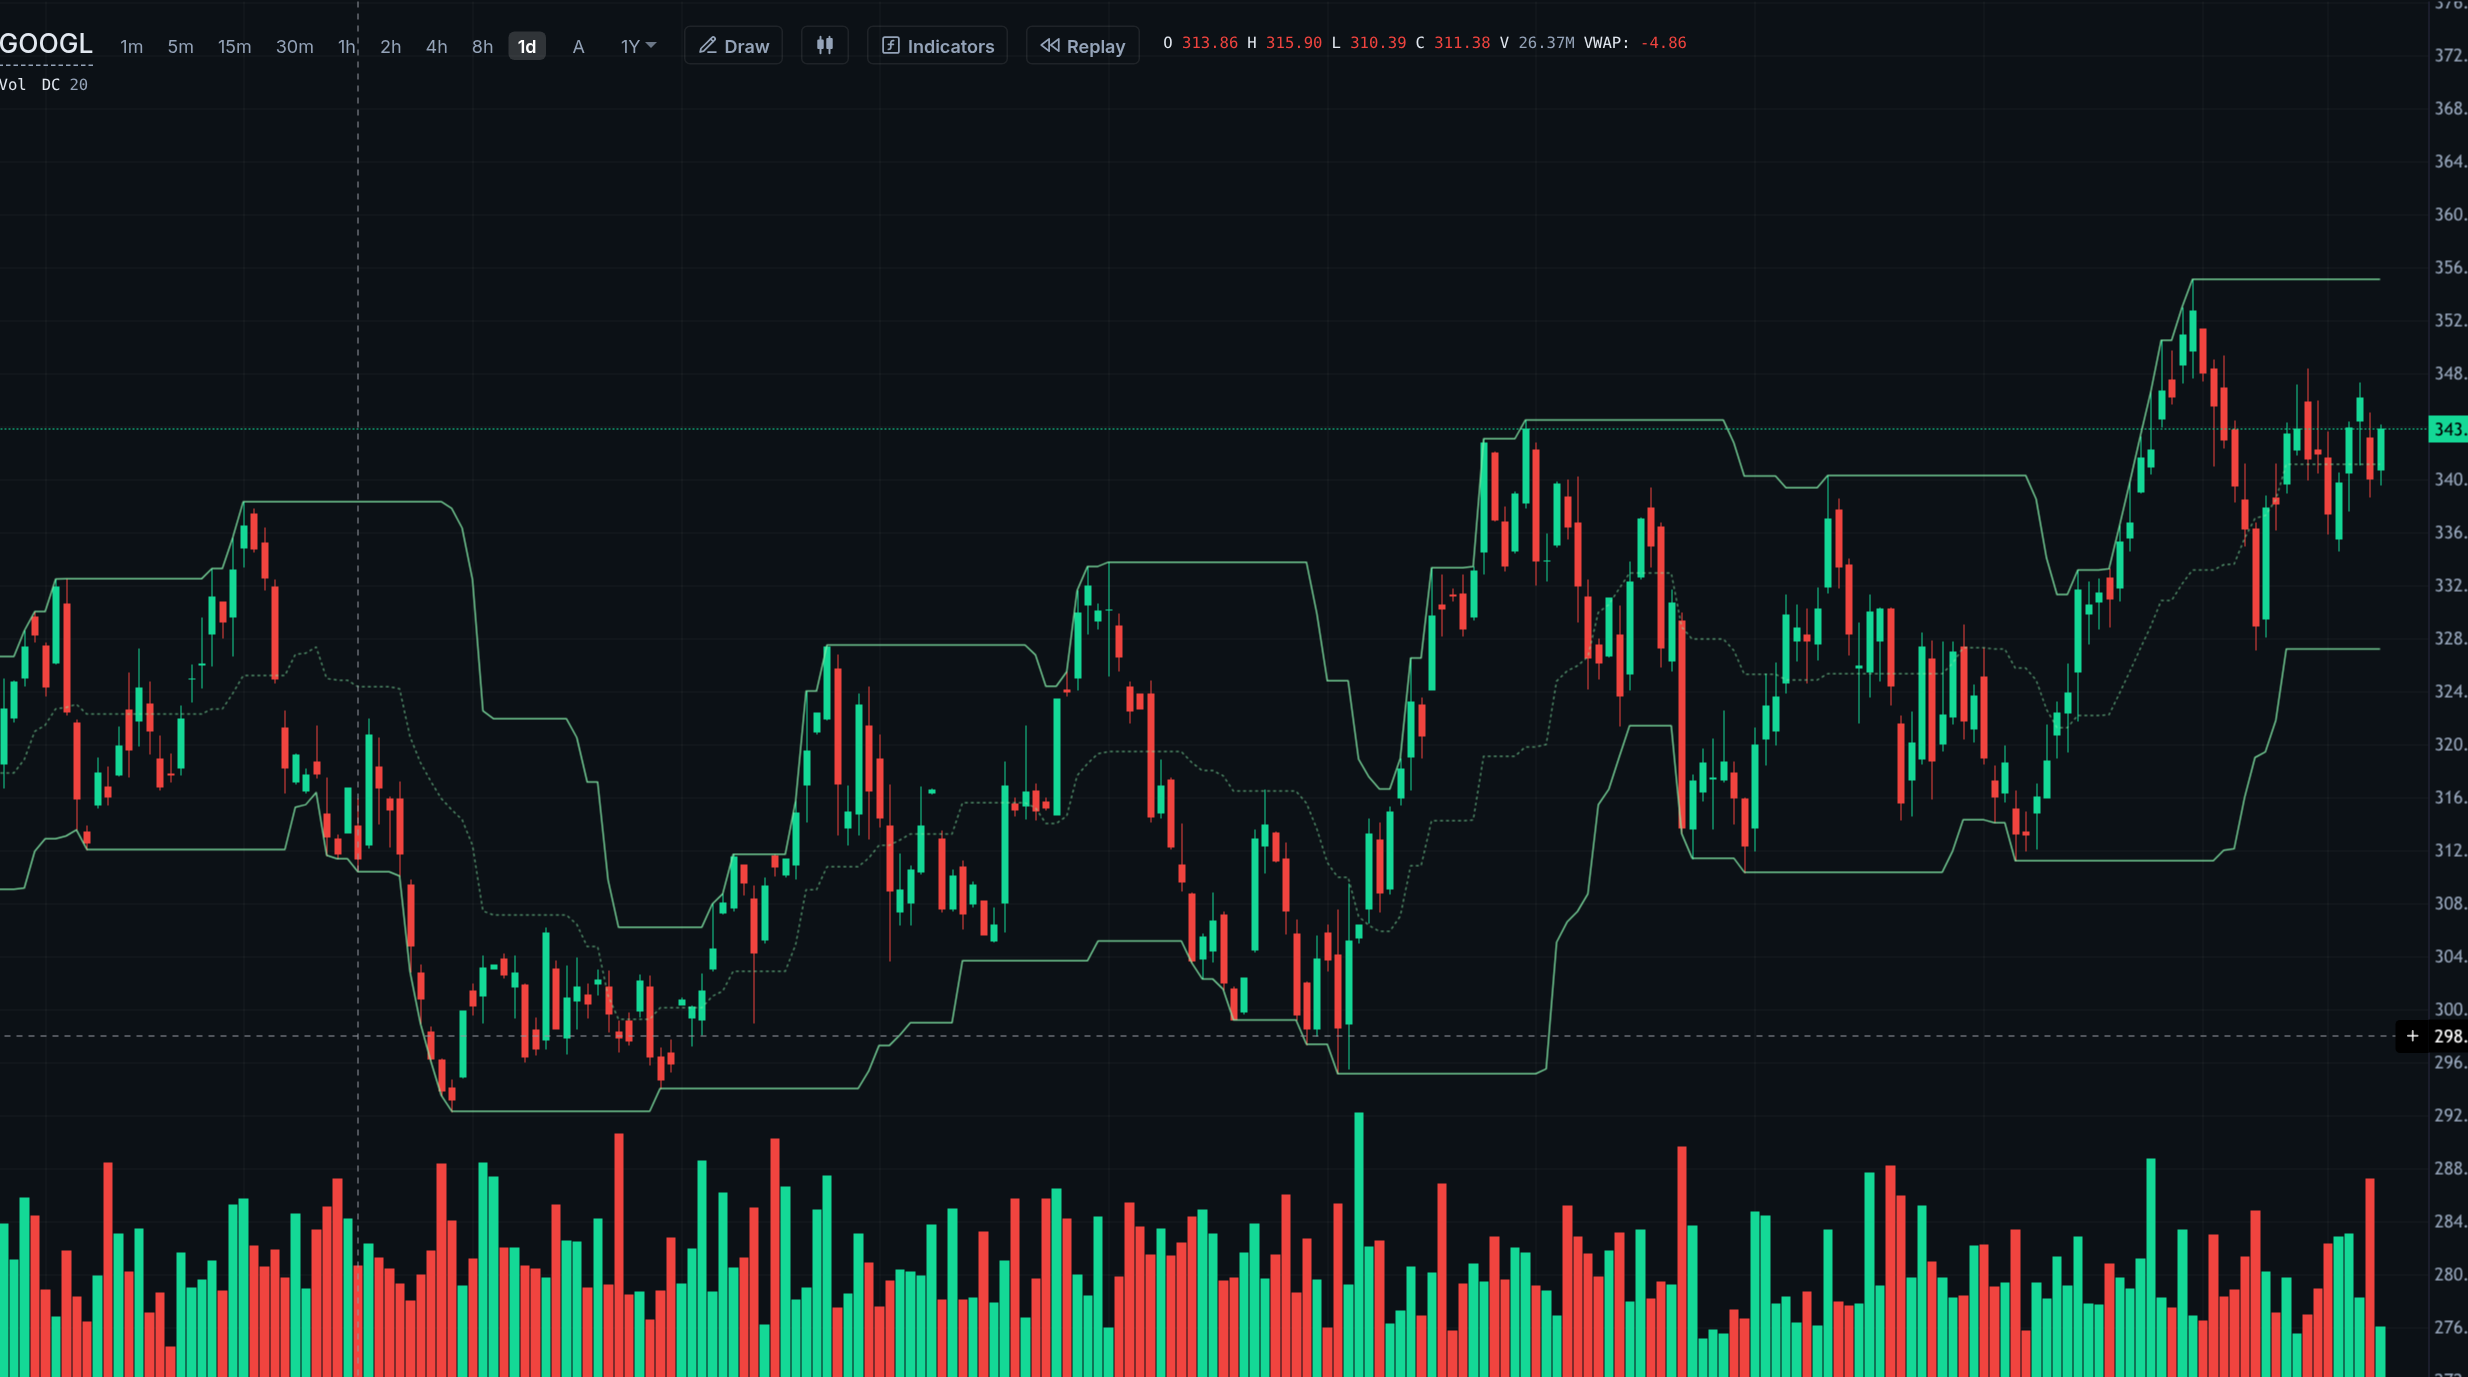
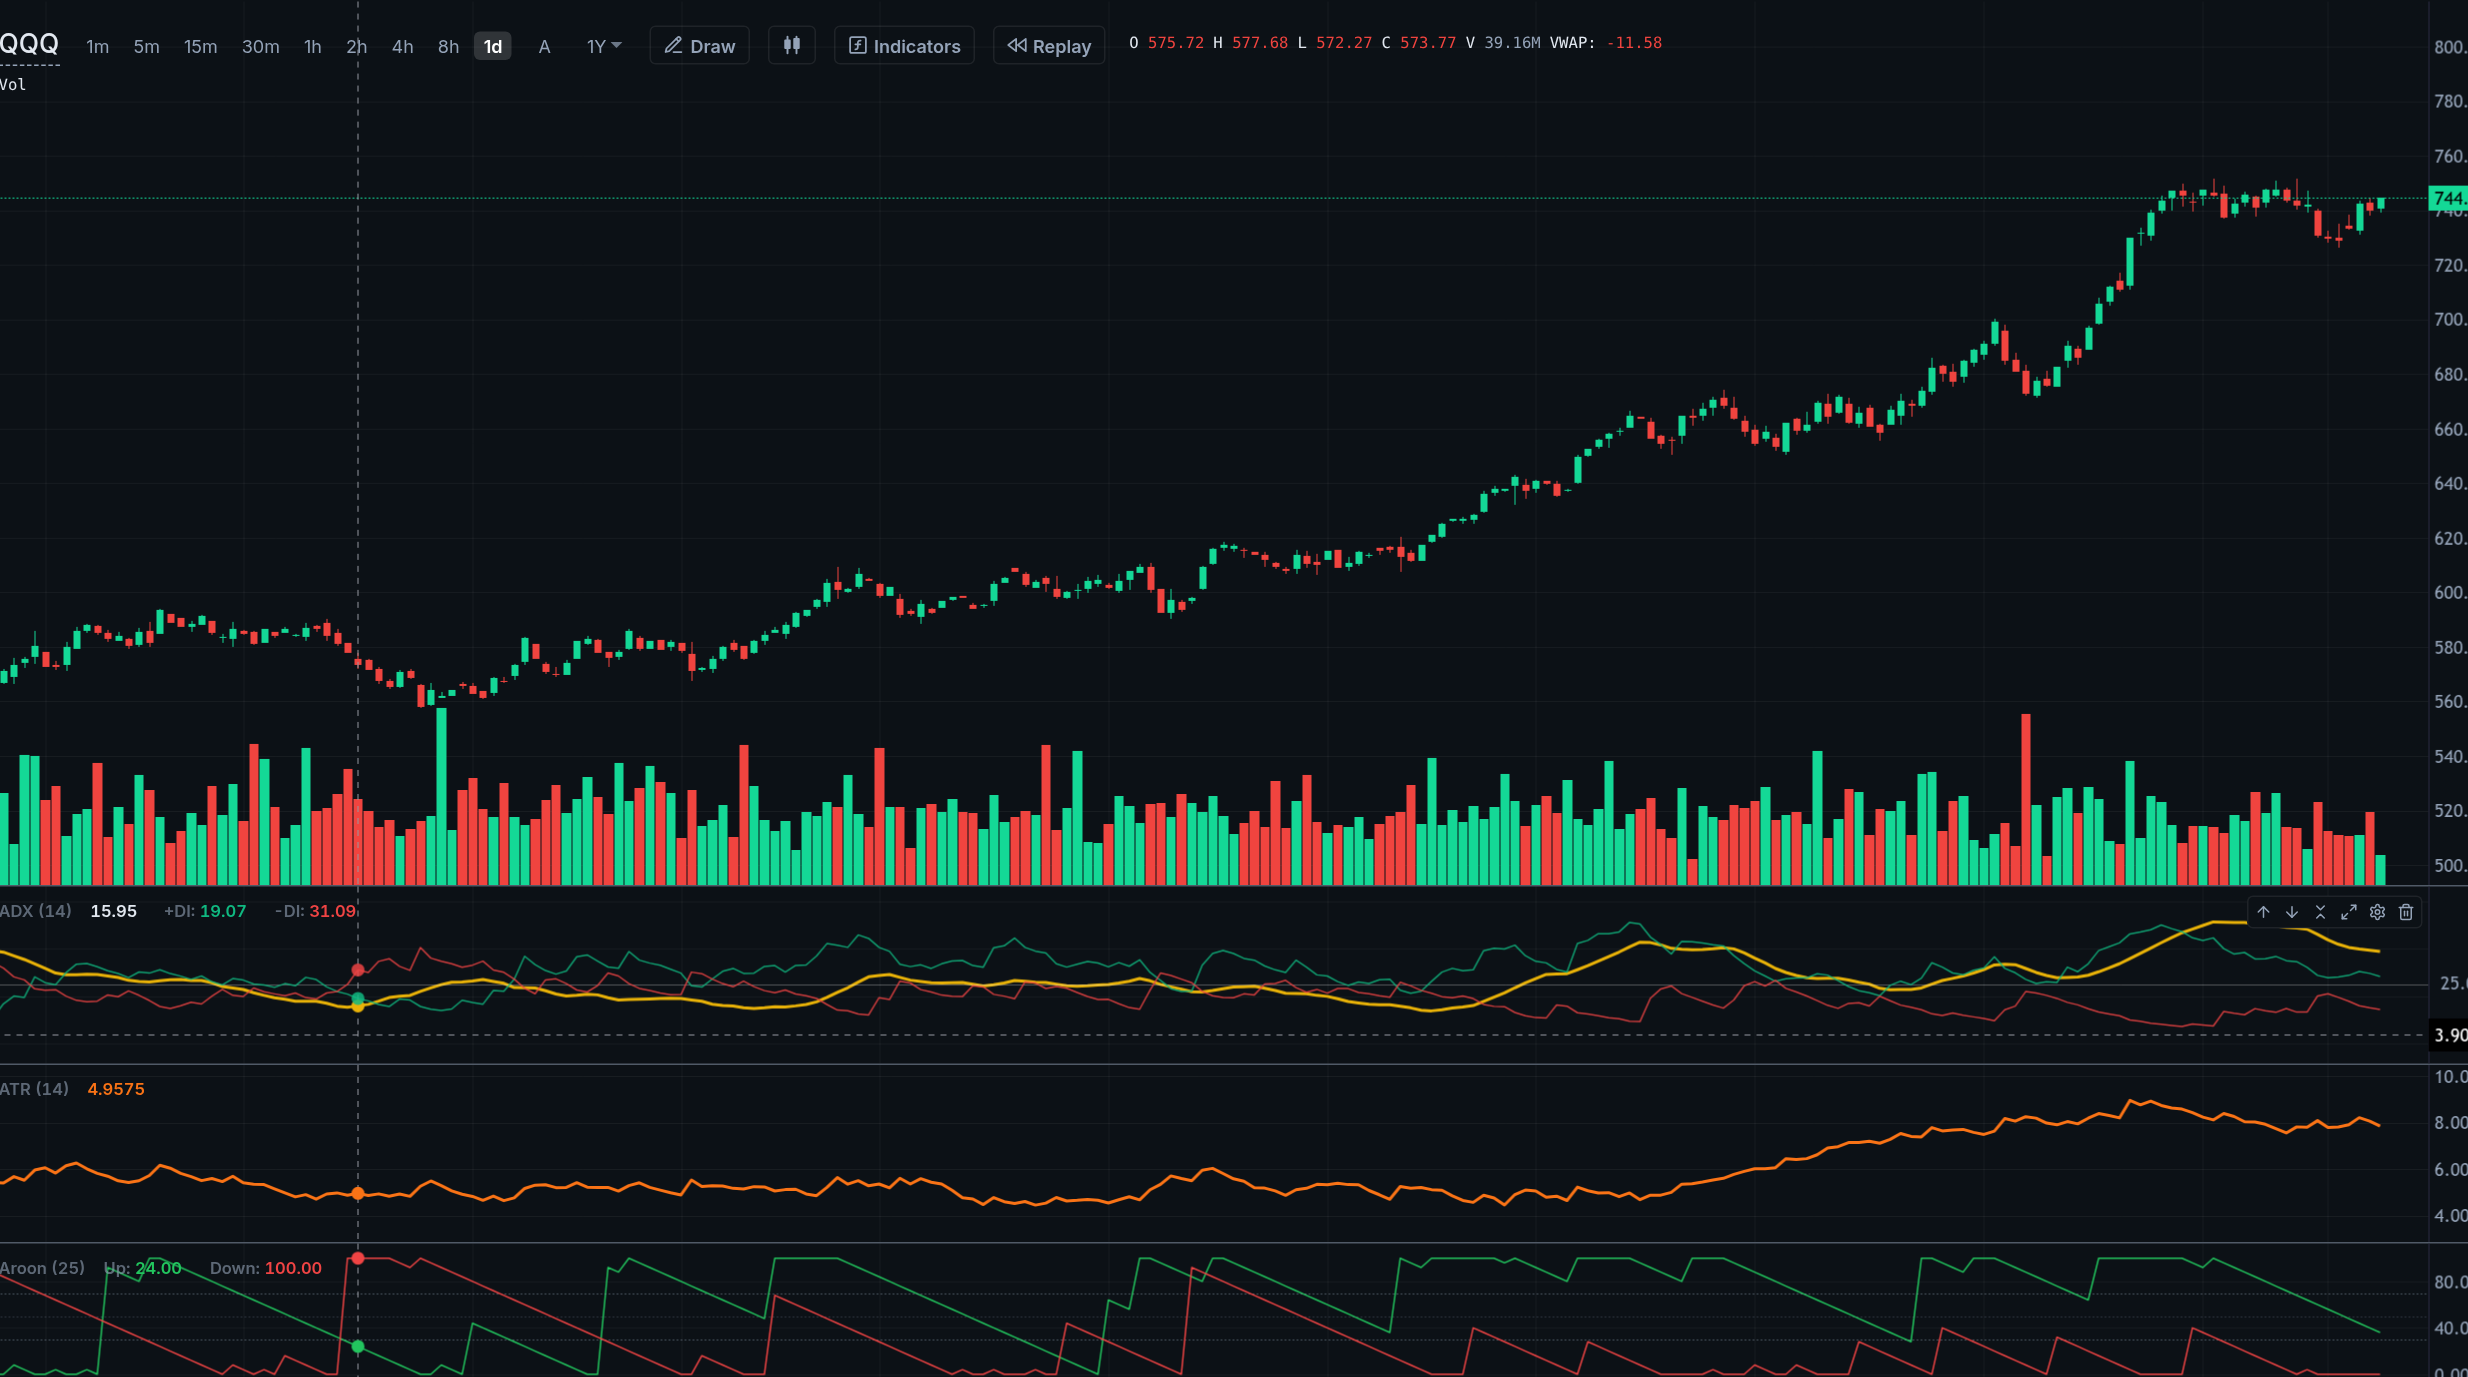
Use moving averages, Bollinger, Keltner and Donchian channels, Ichimoku, Supertrend, parabolic SAR and long-term highs.
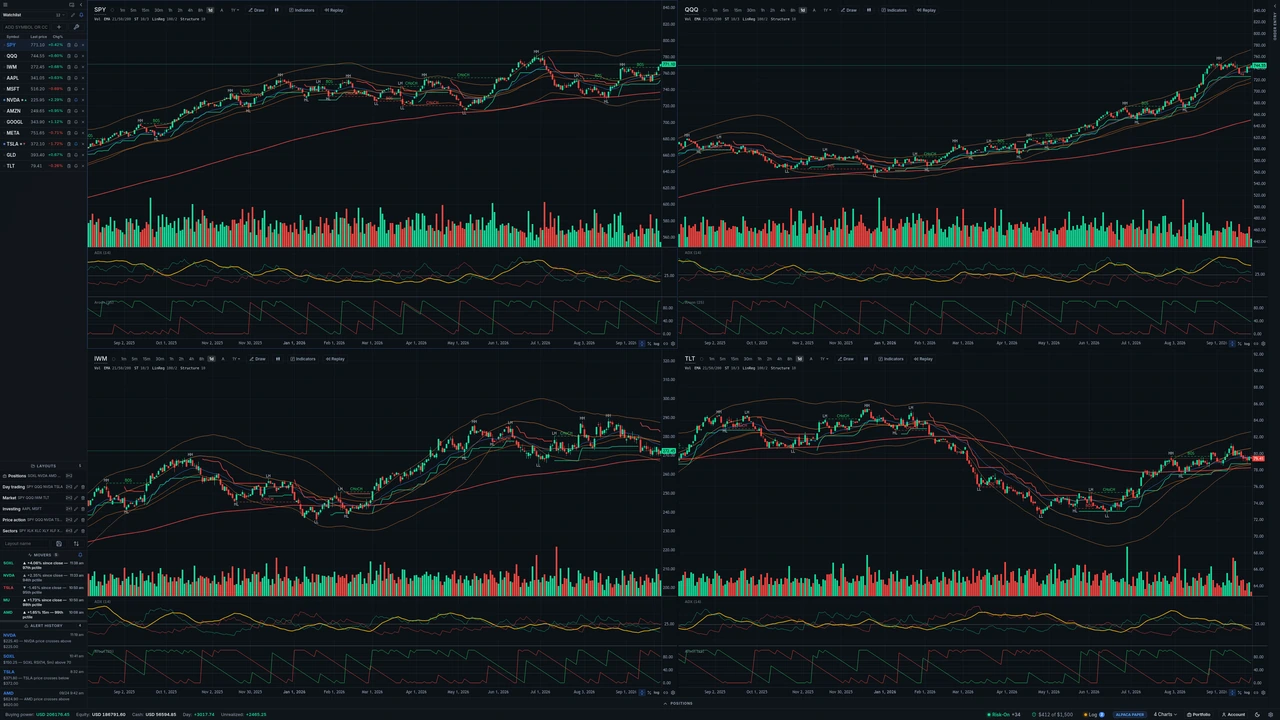
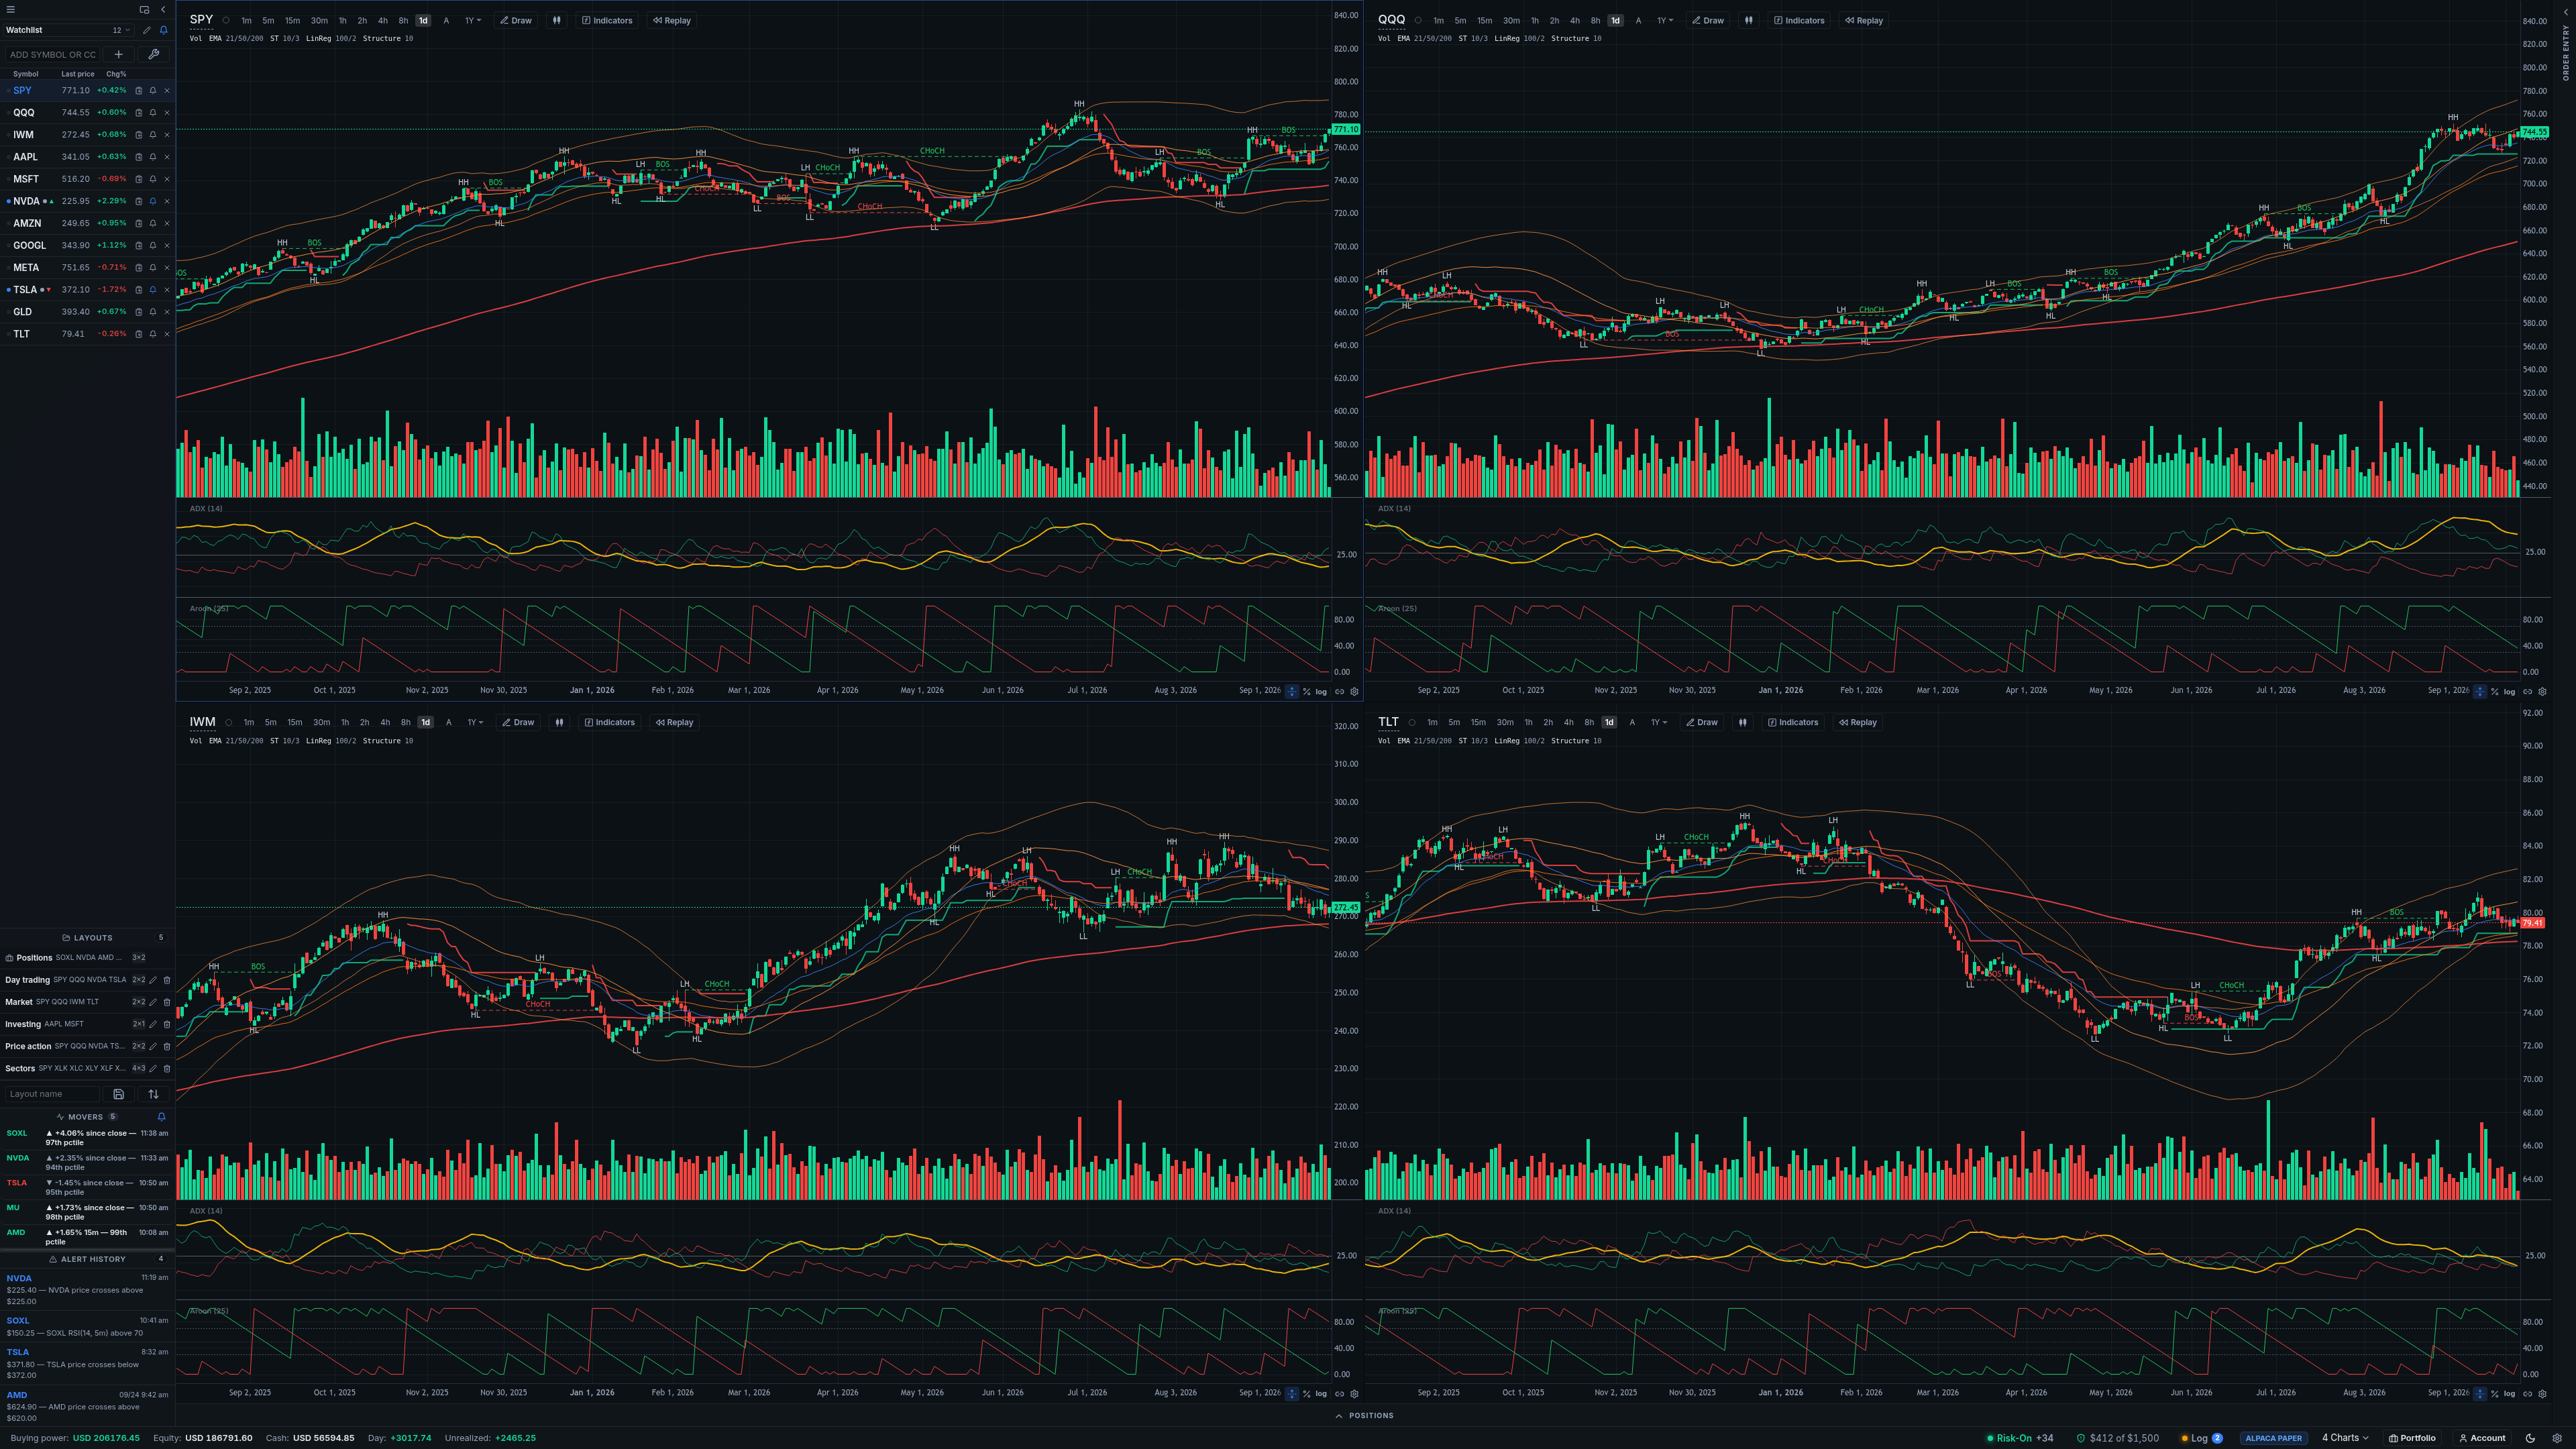
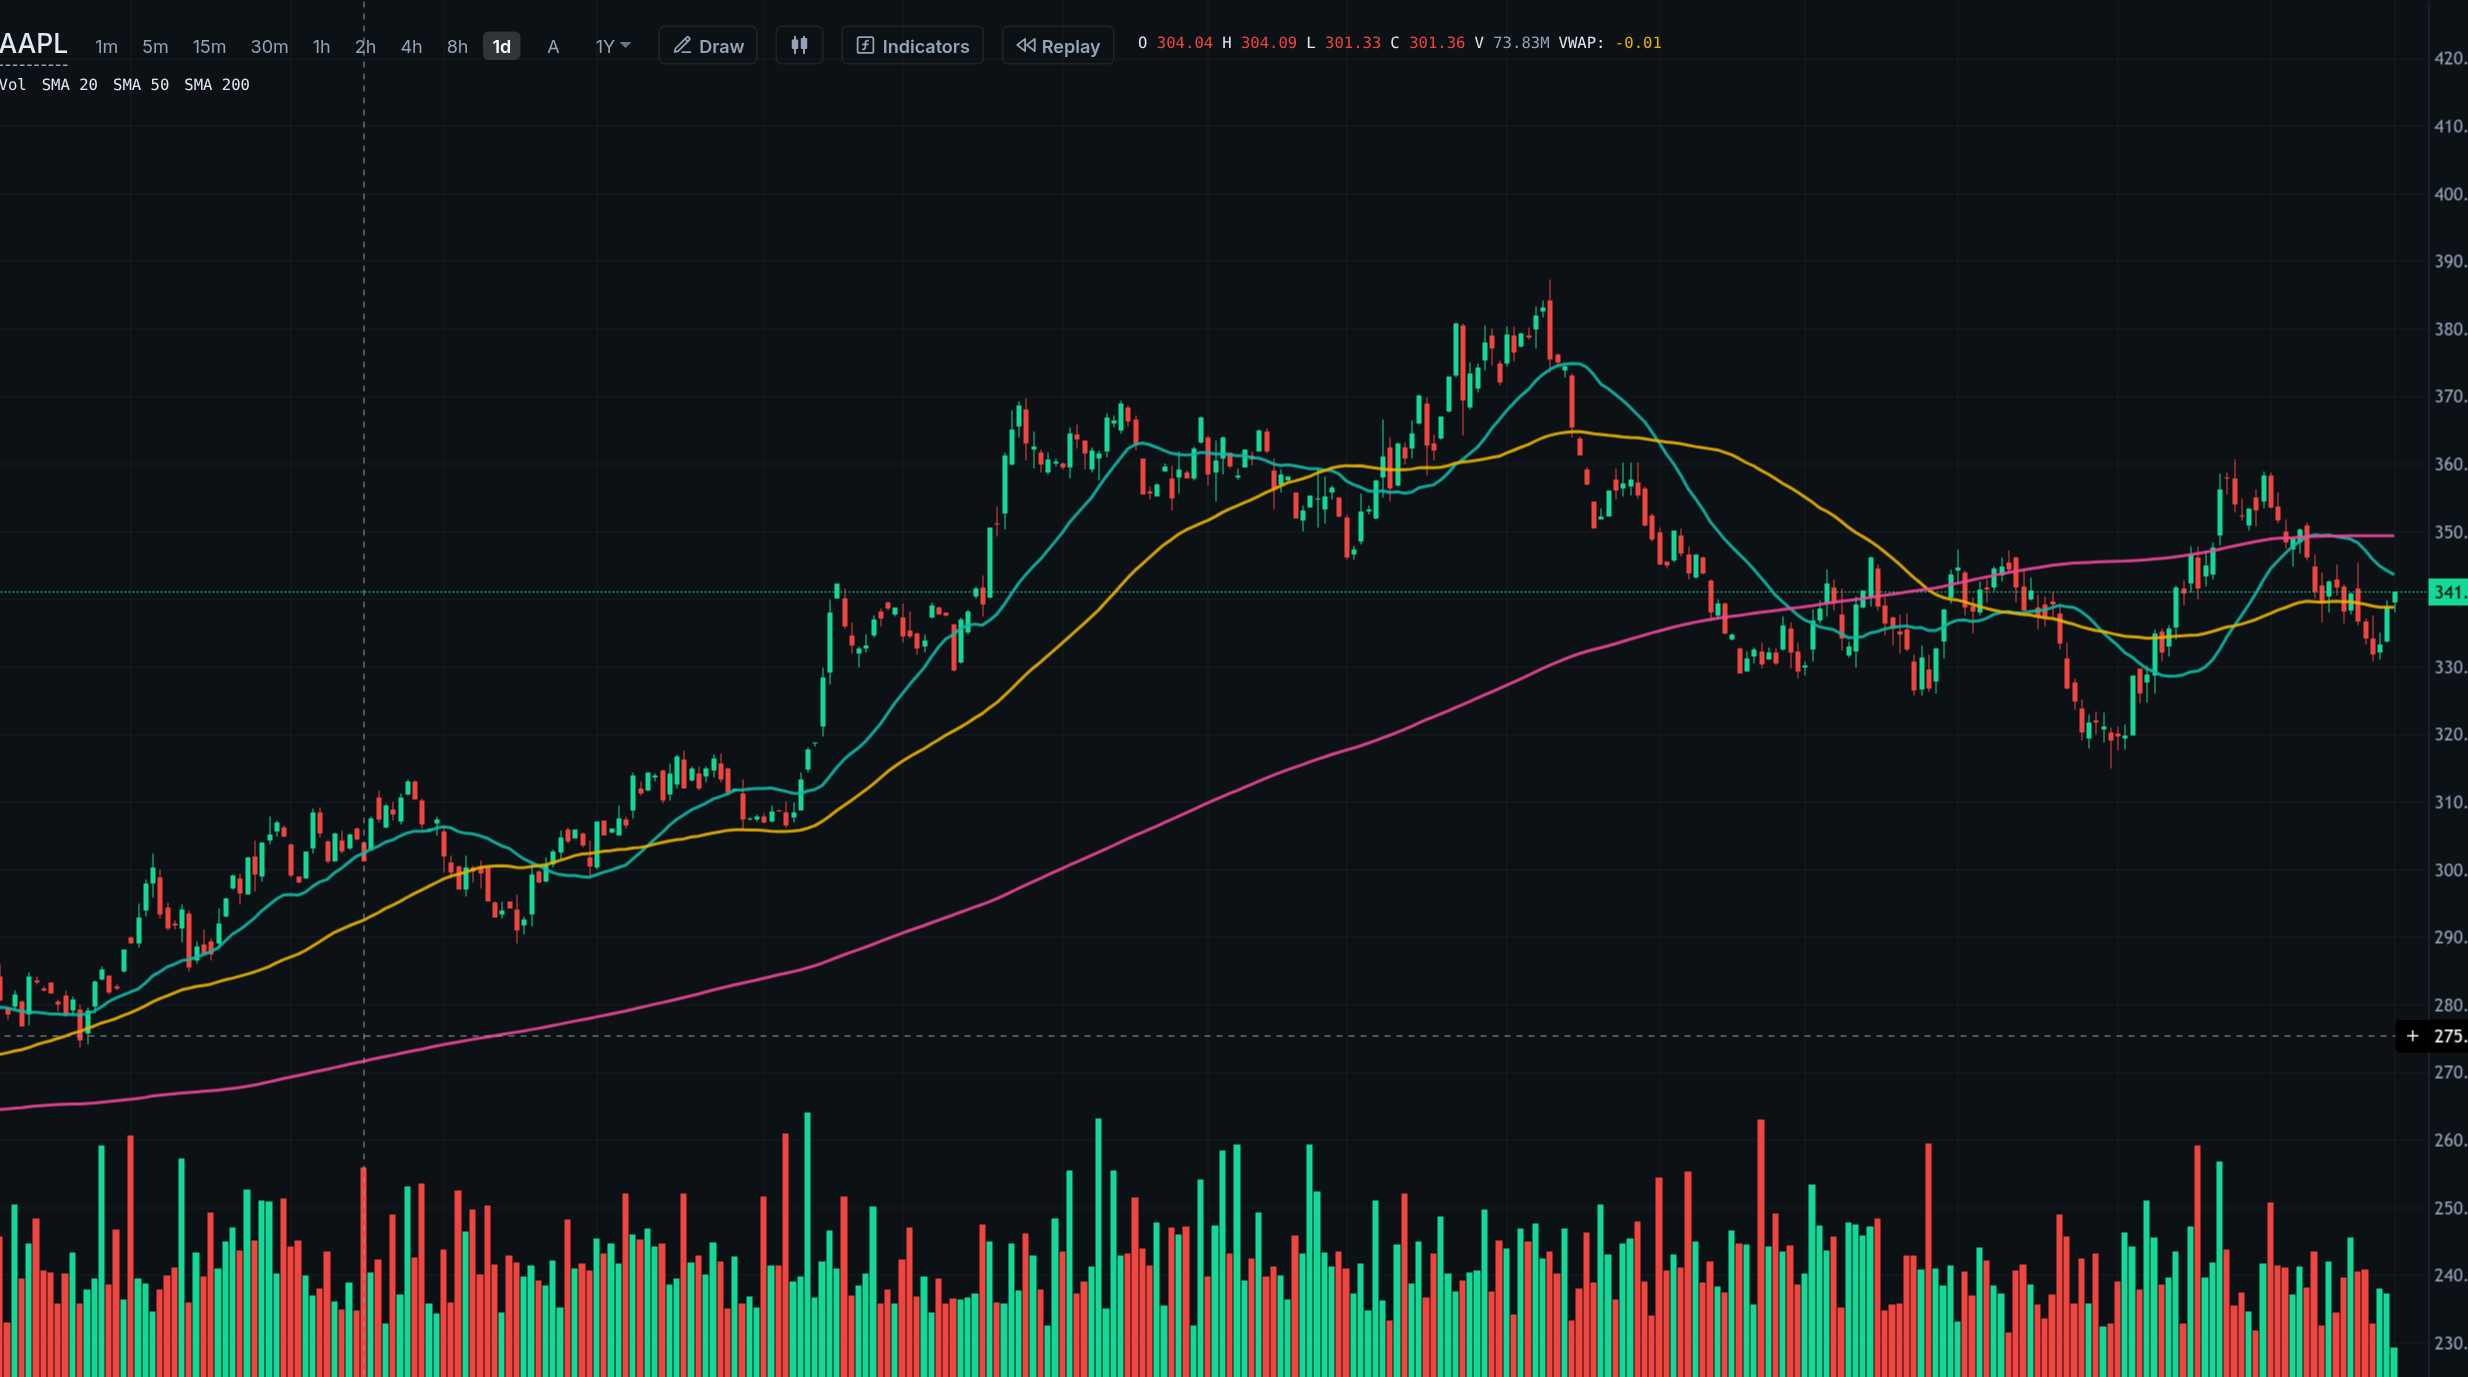
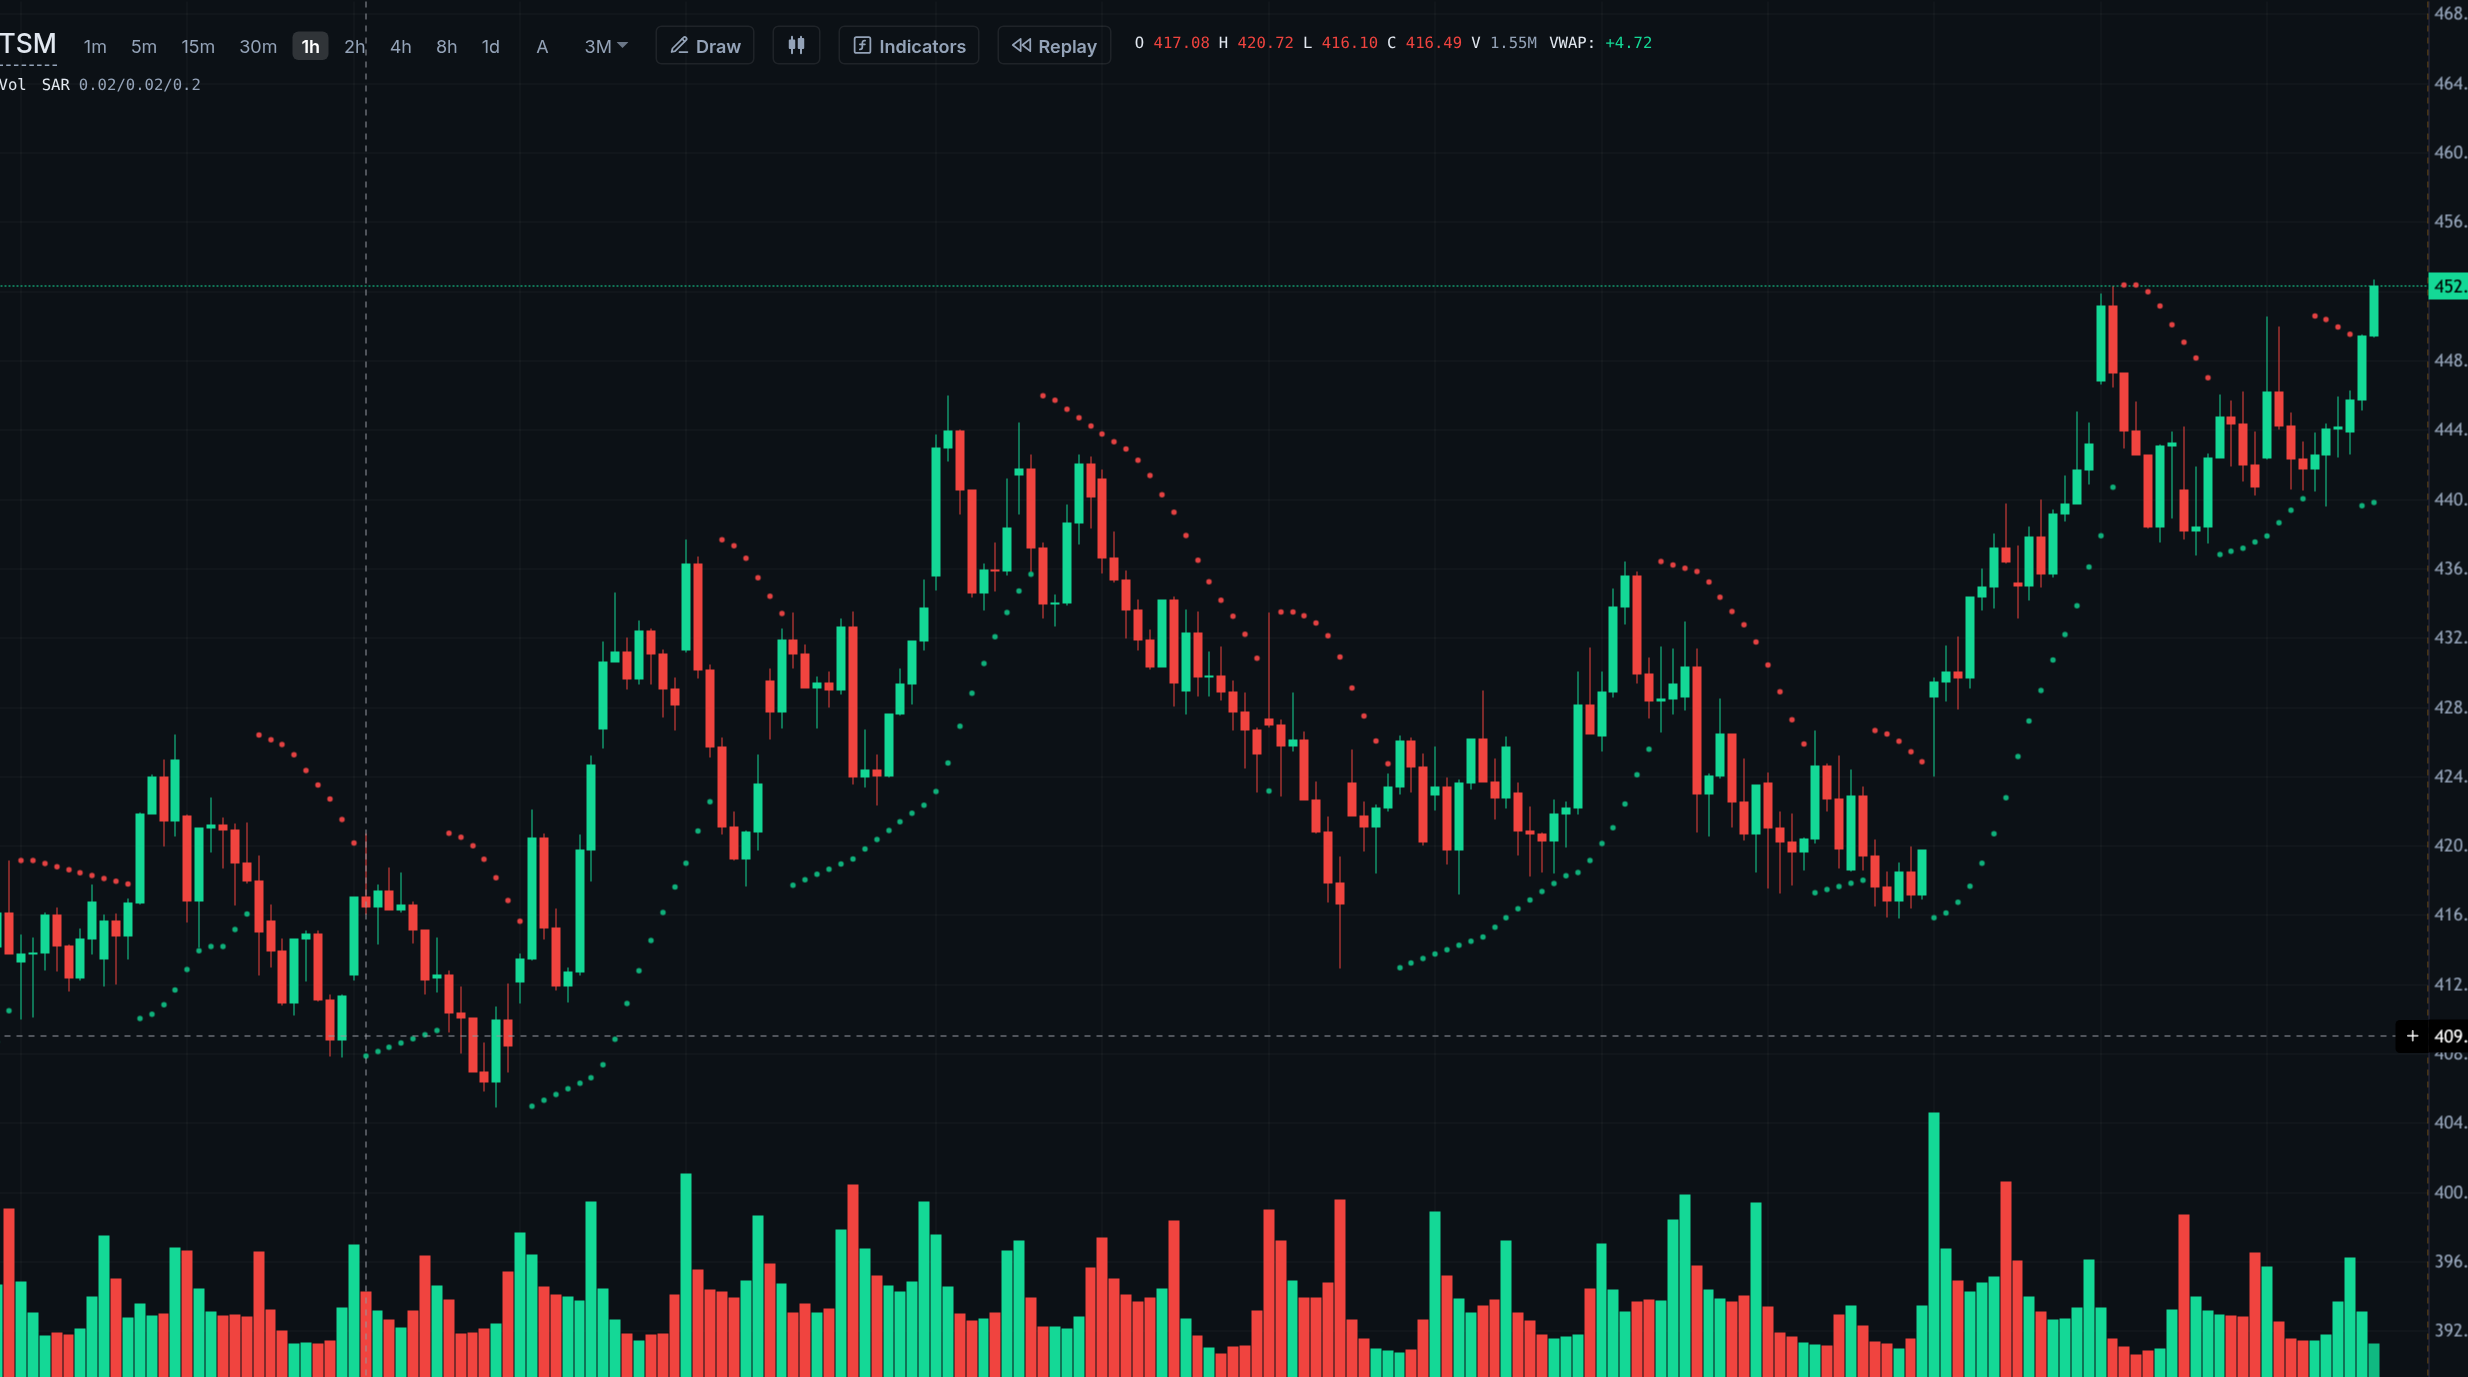
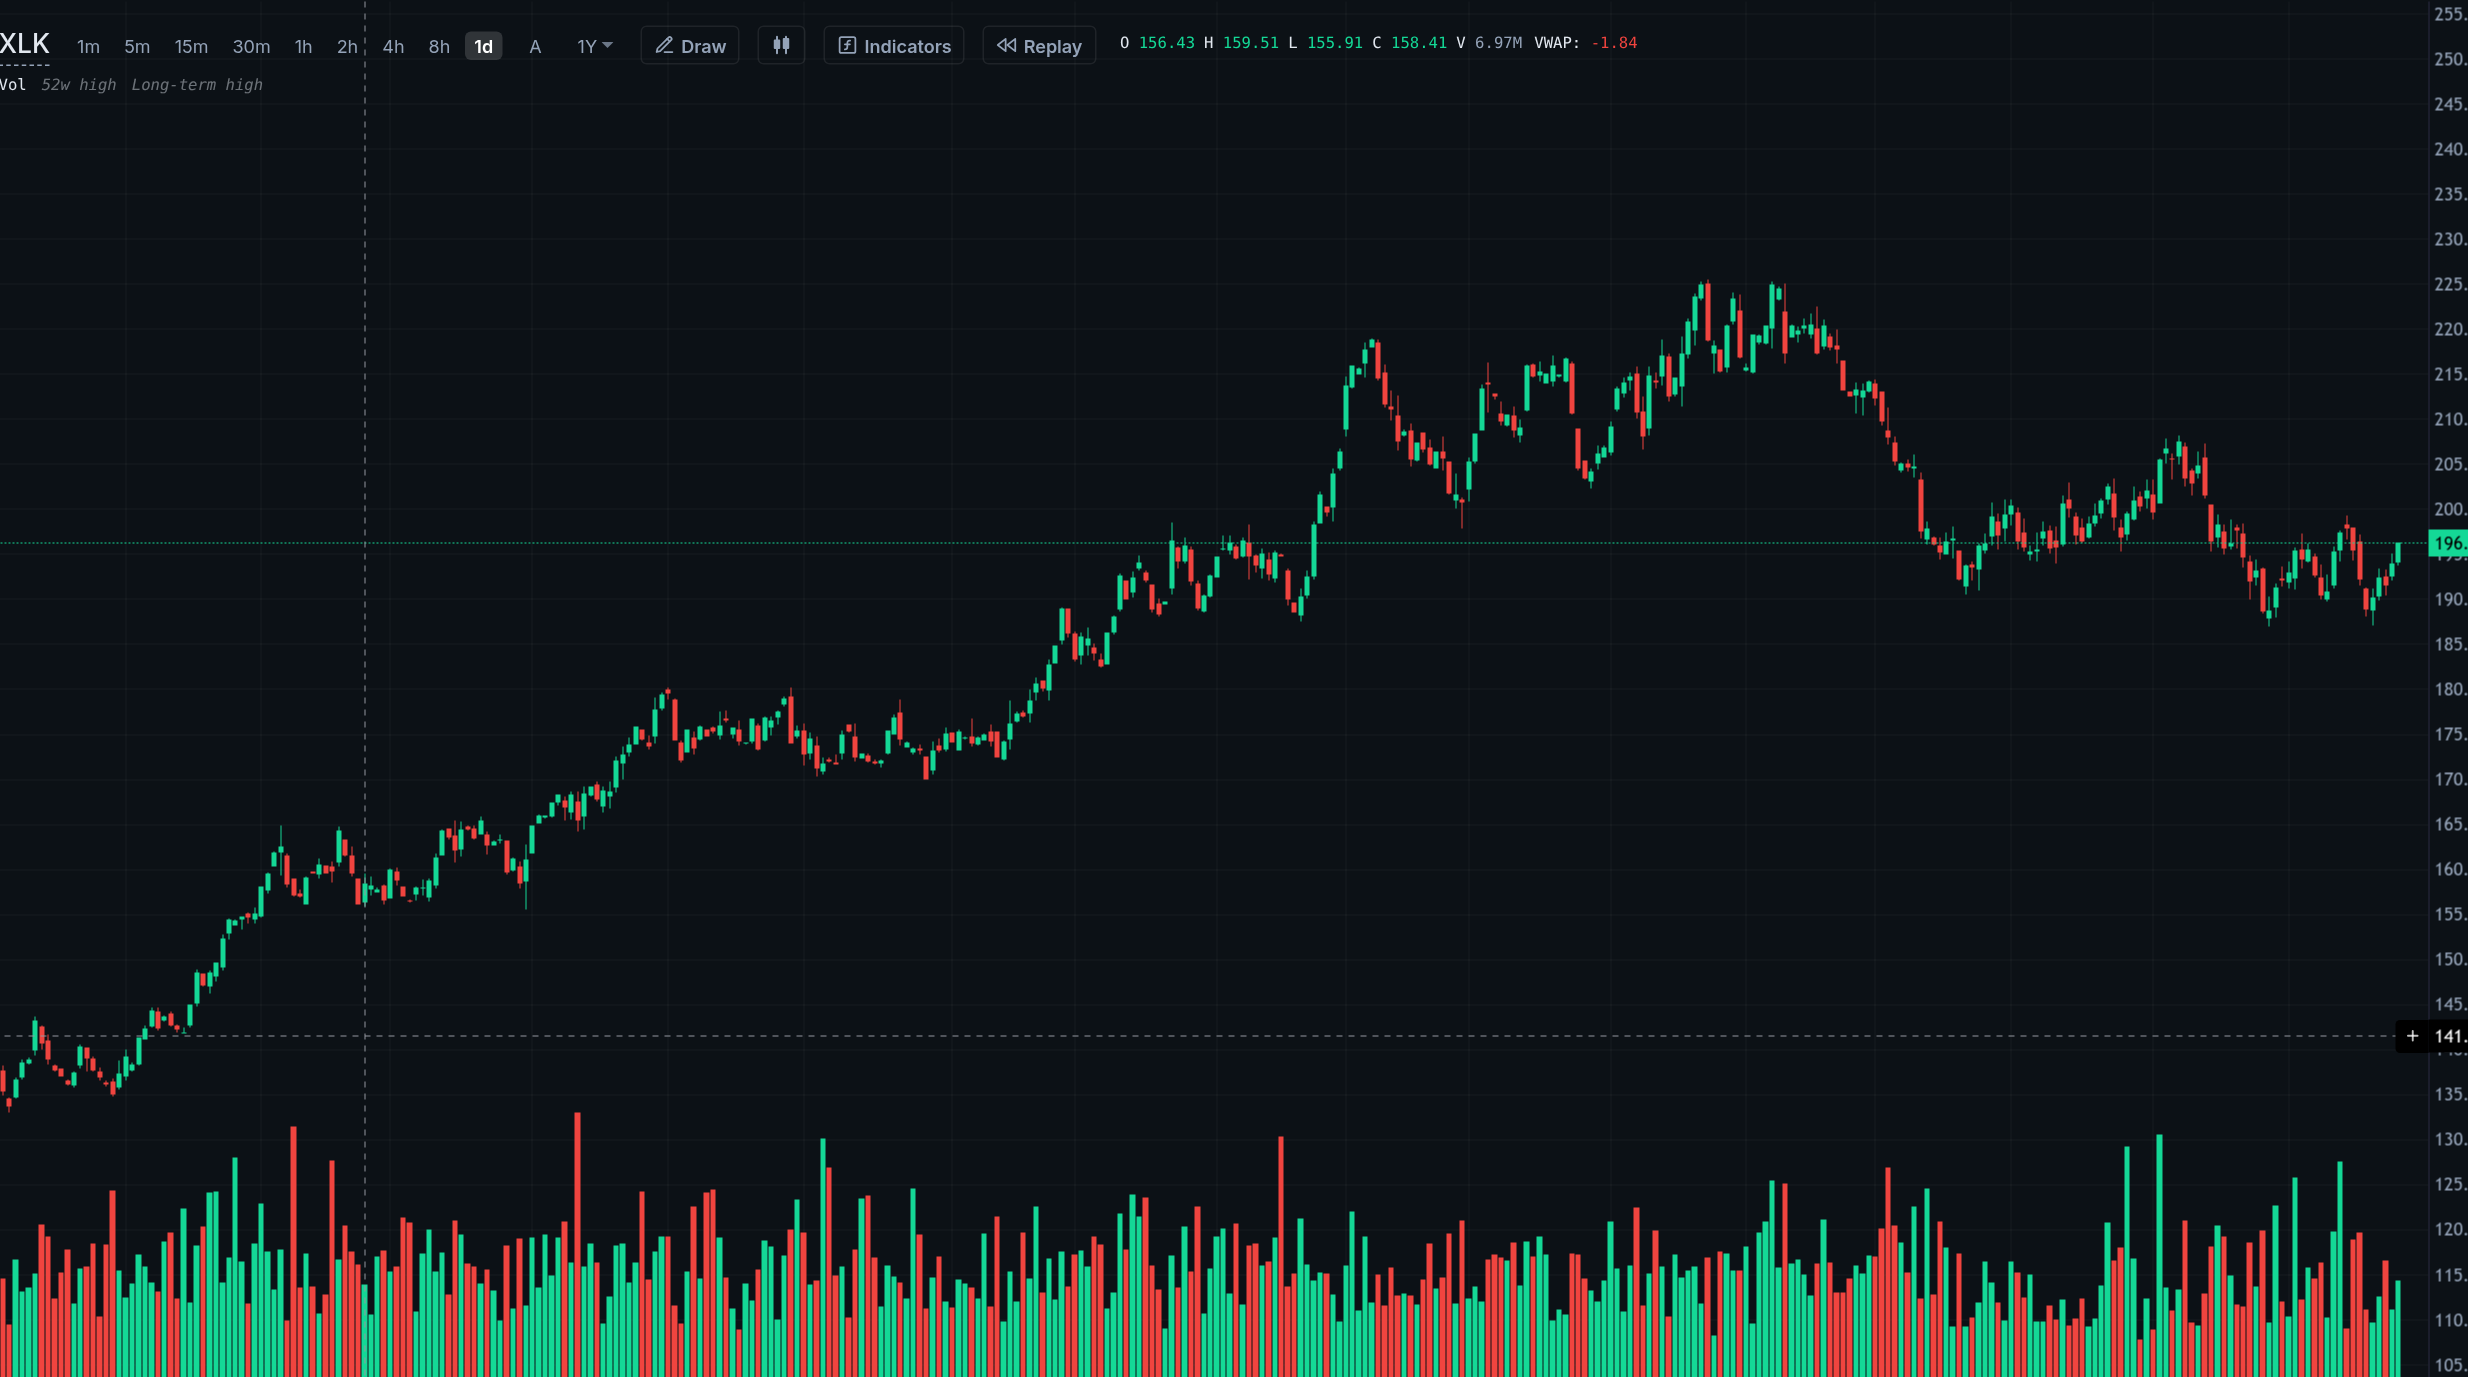
Zones, swings and trendlines, found automatically
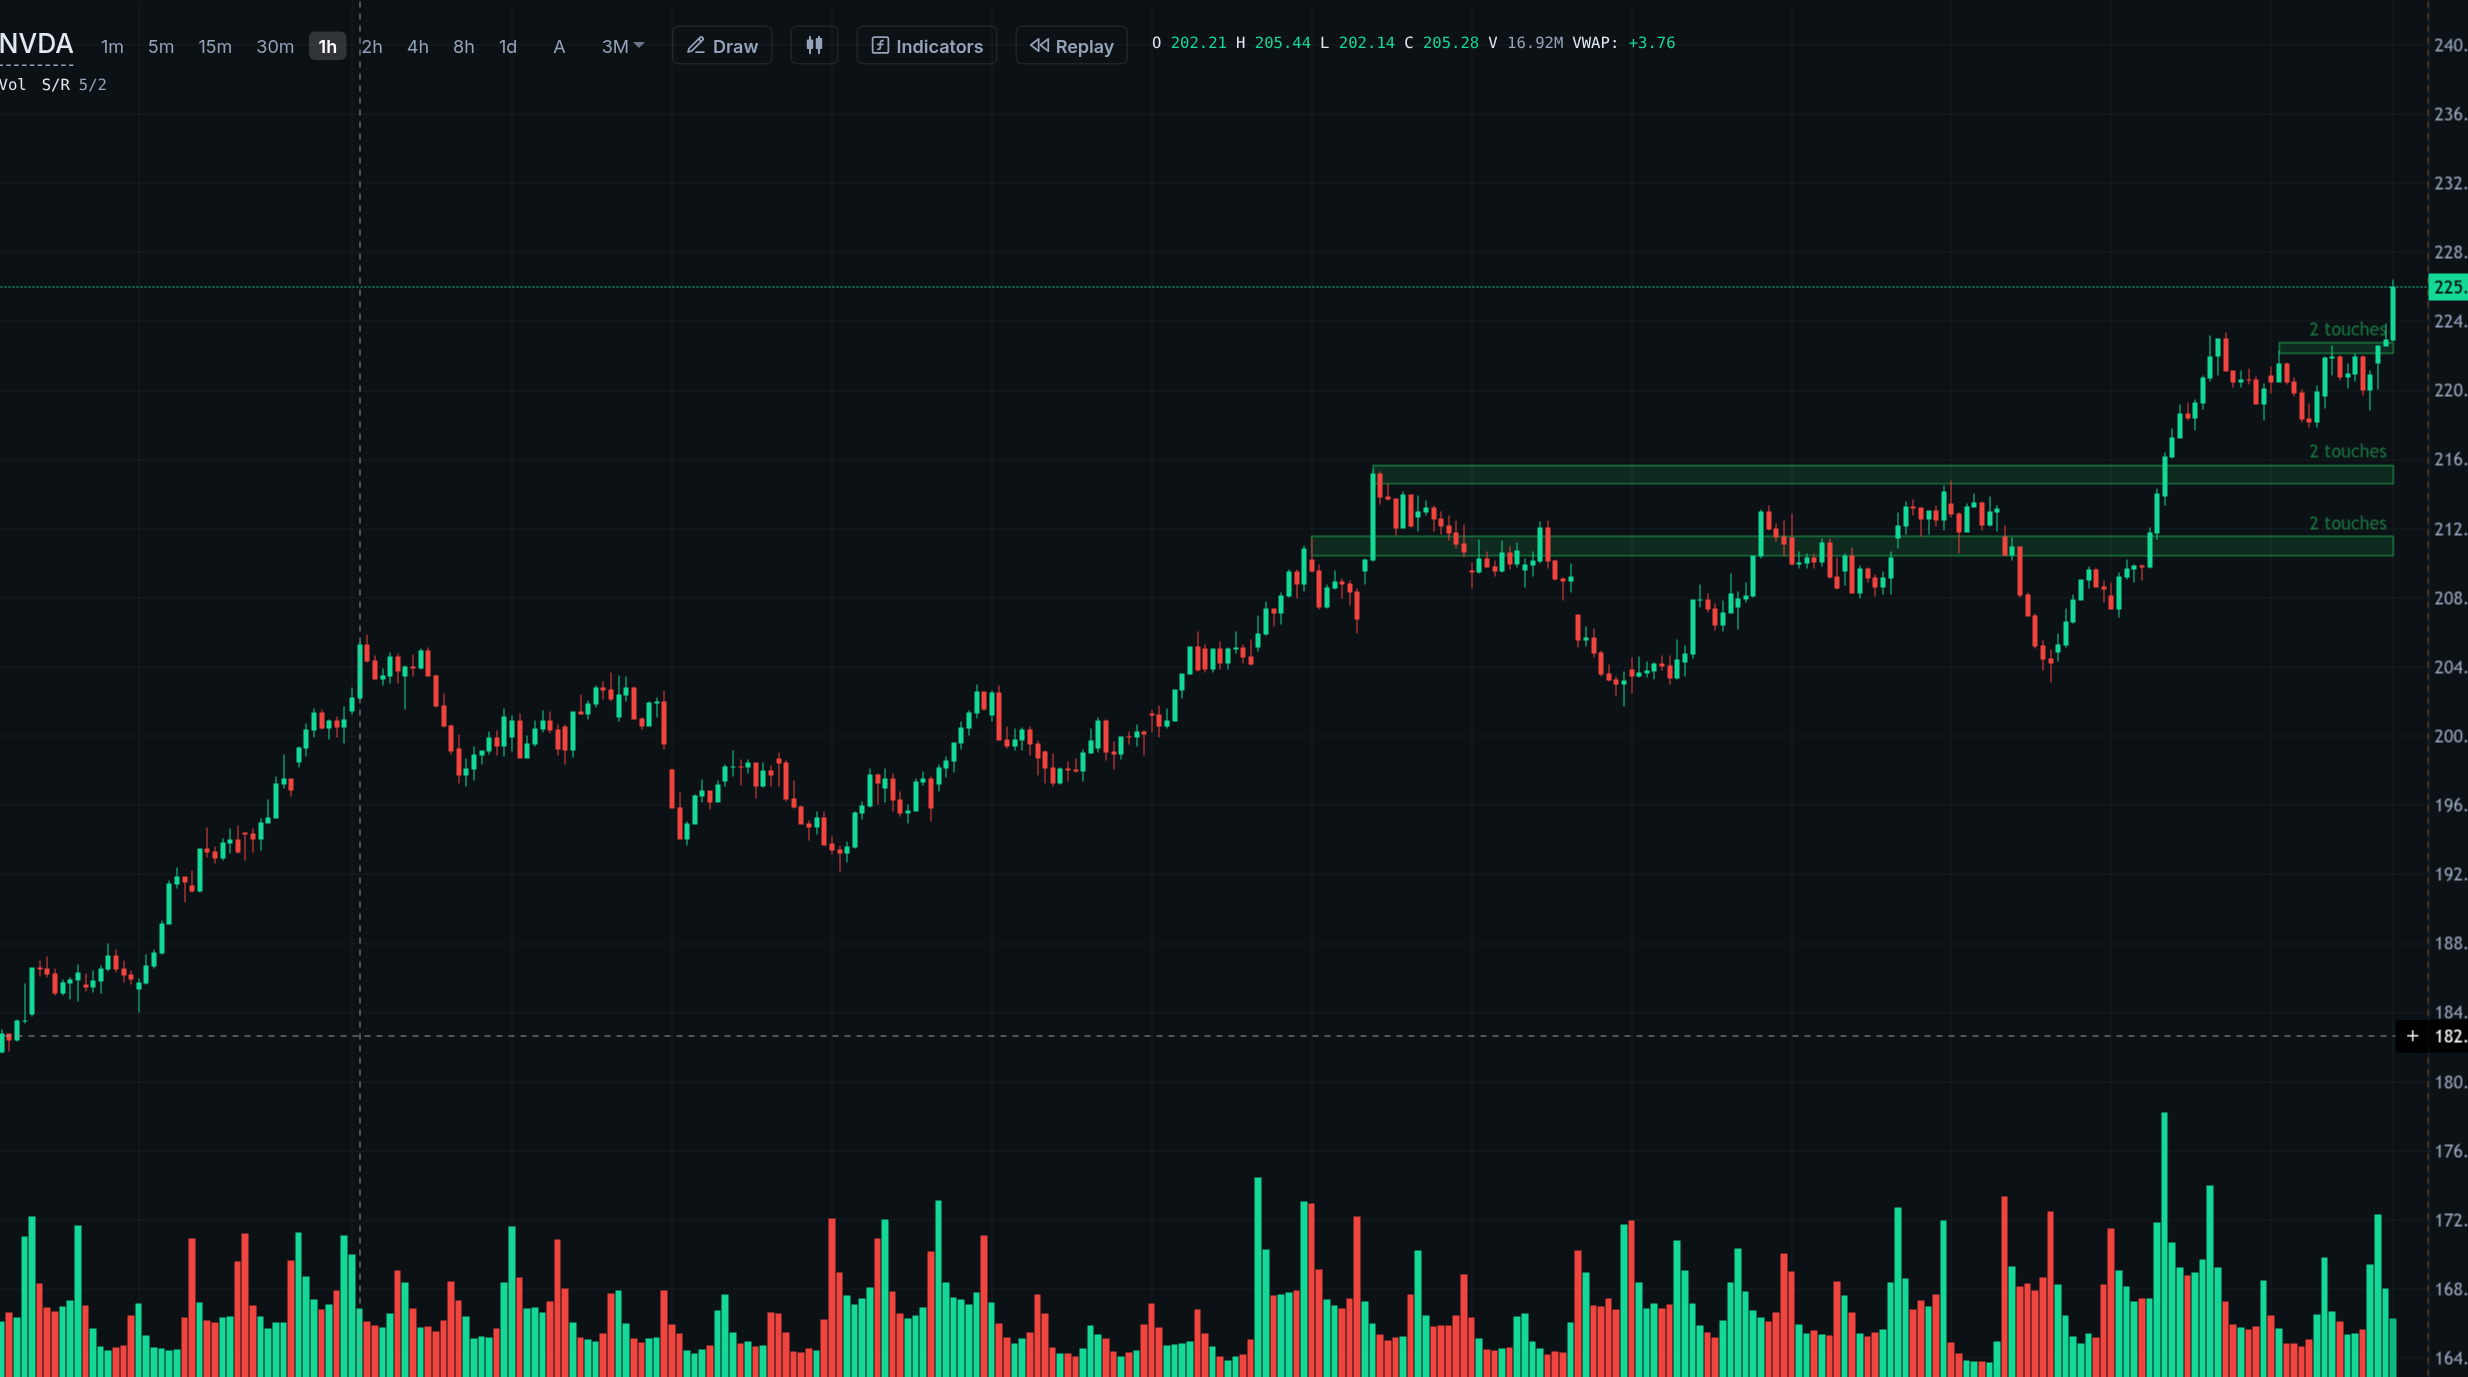
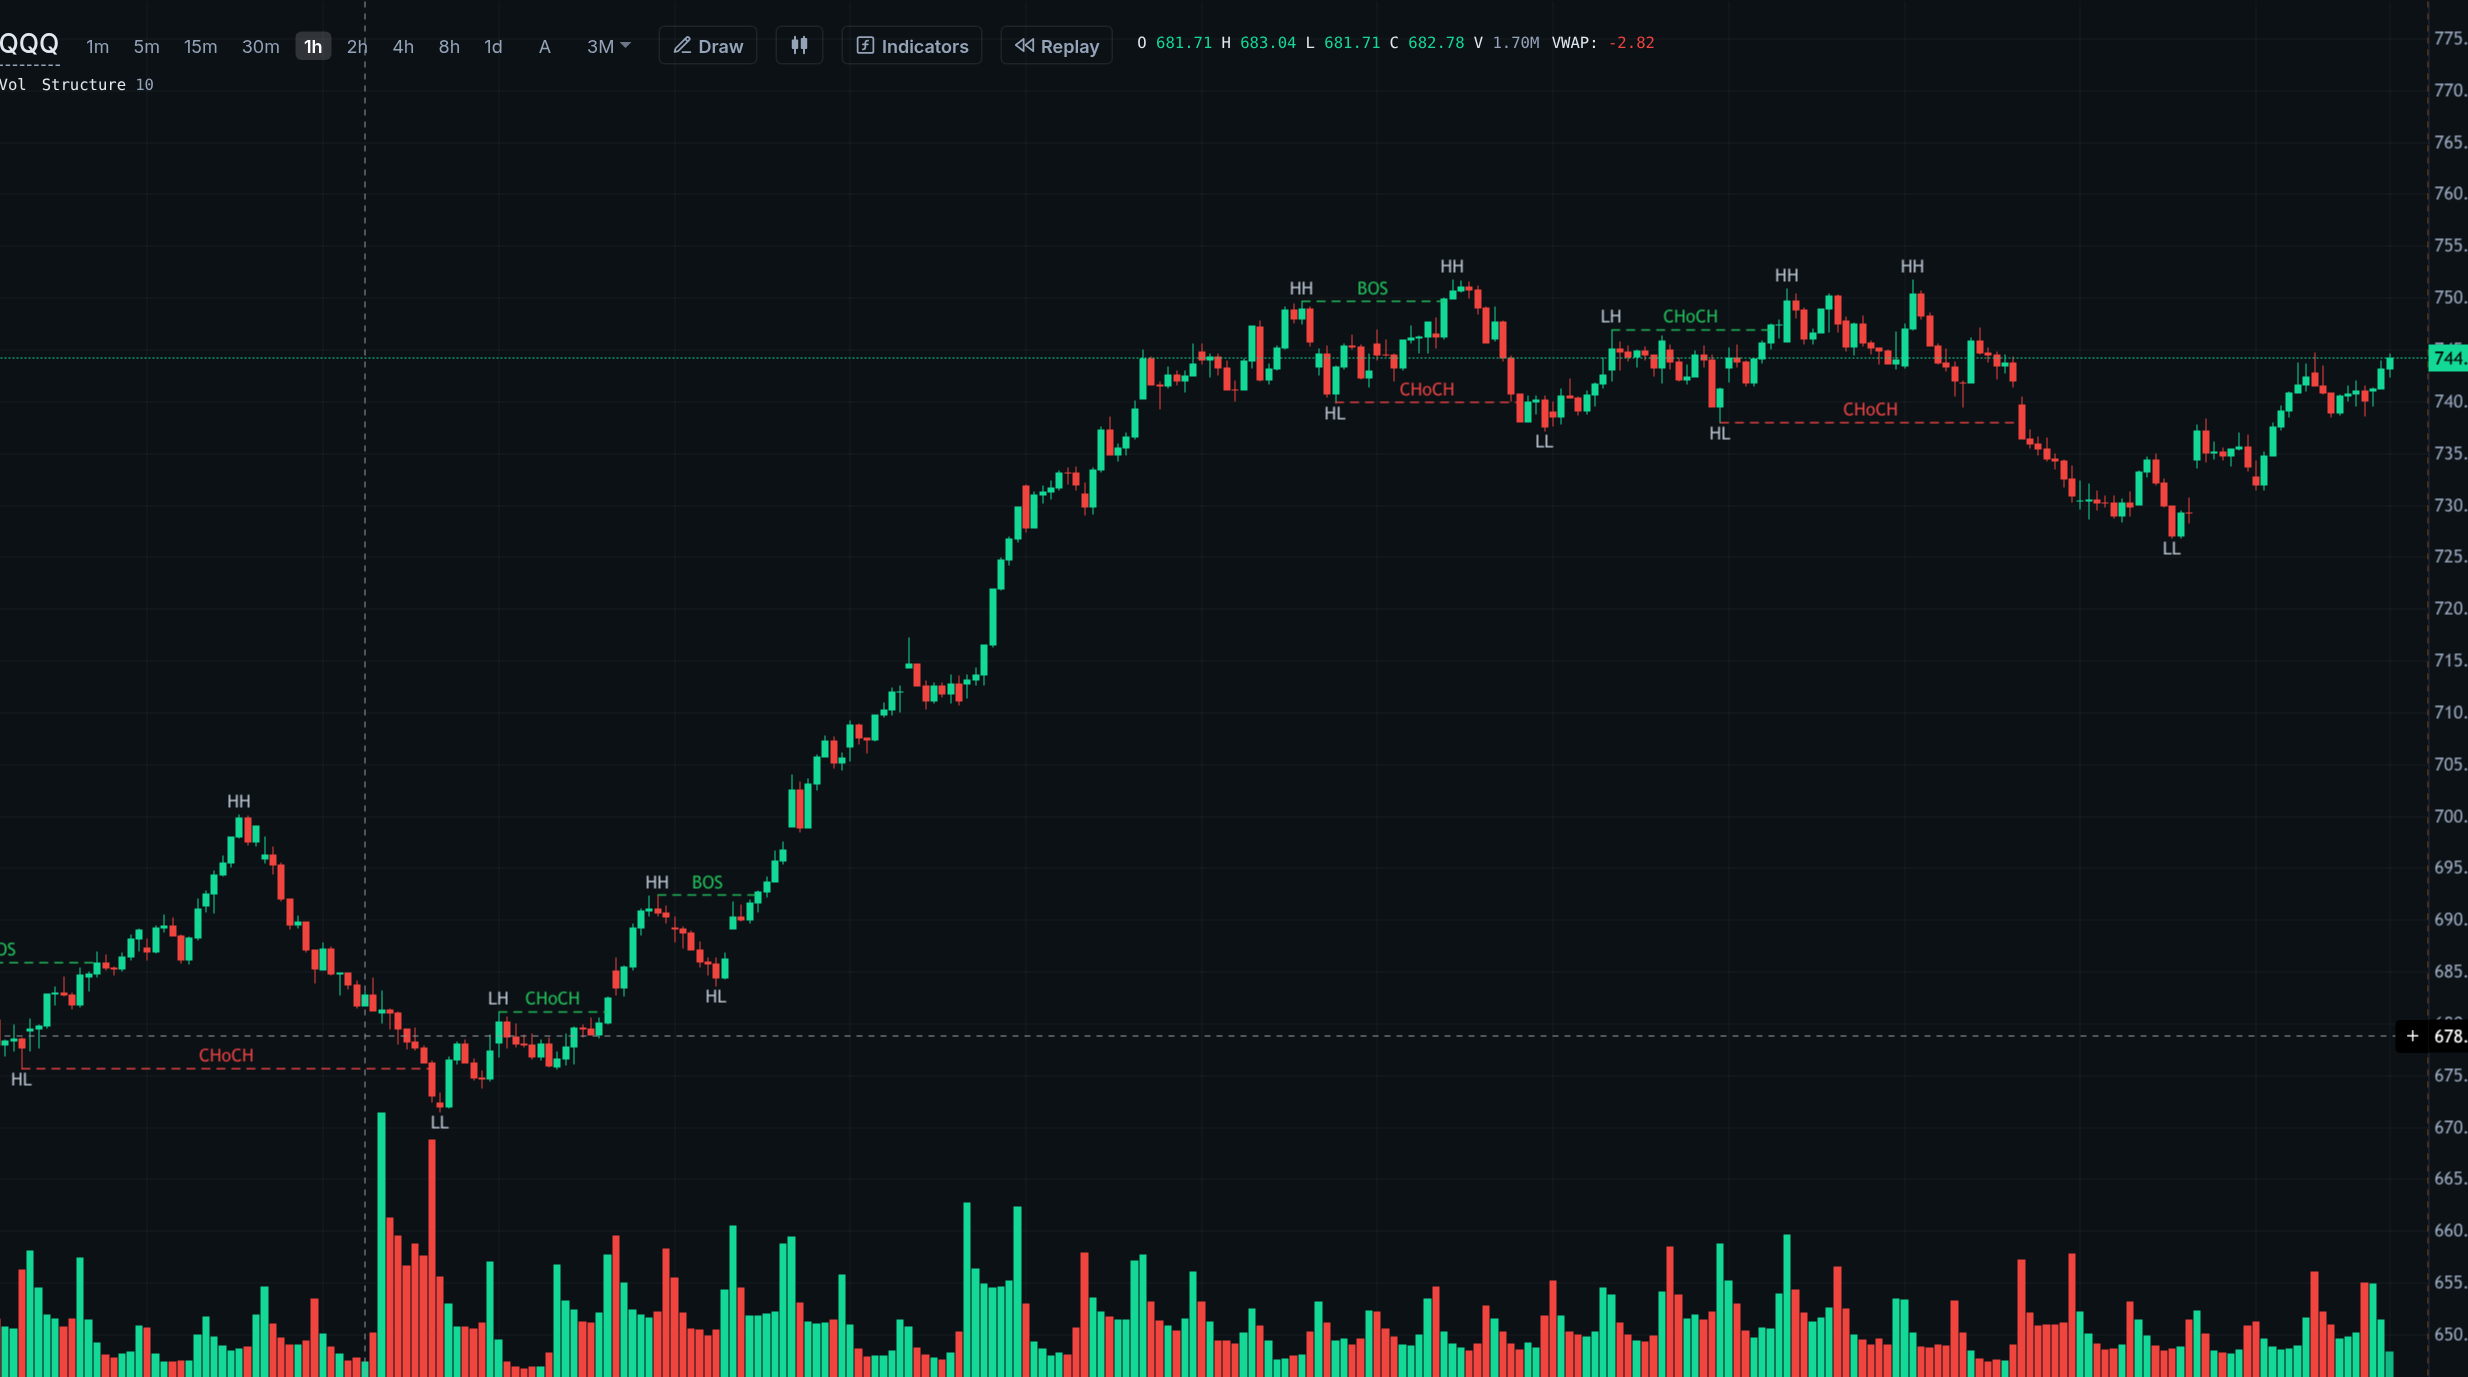
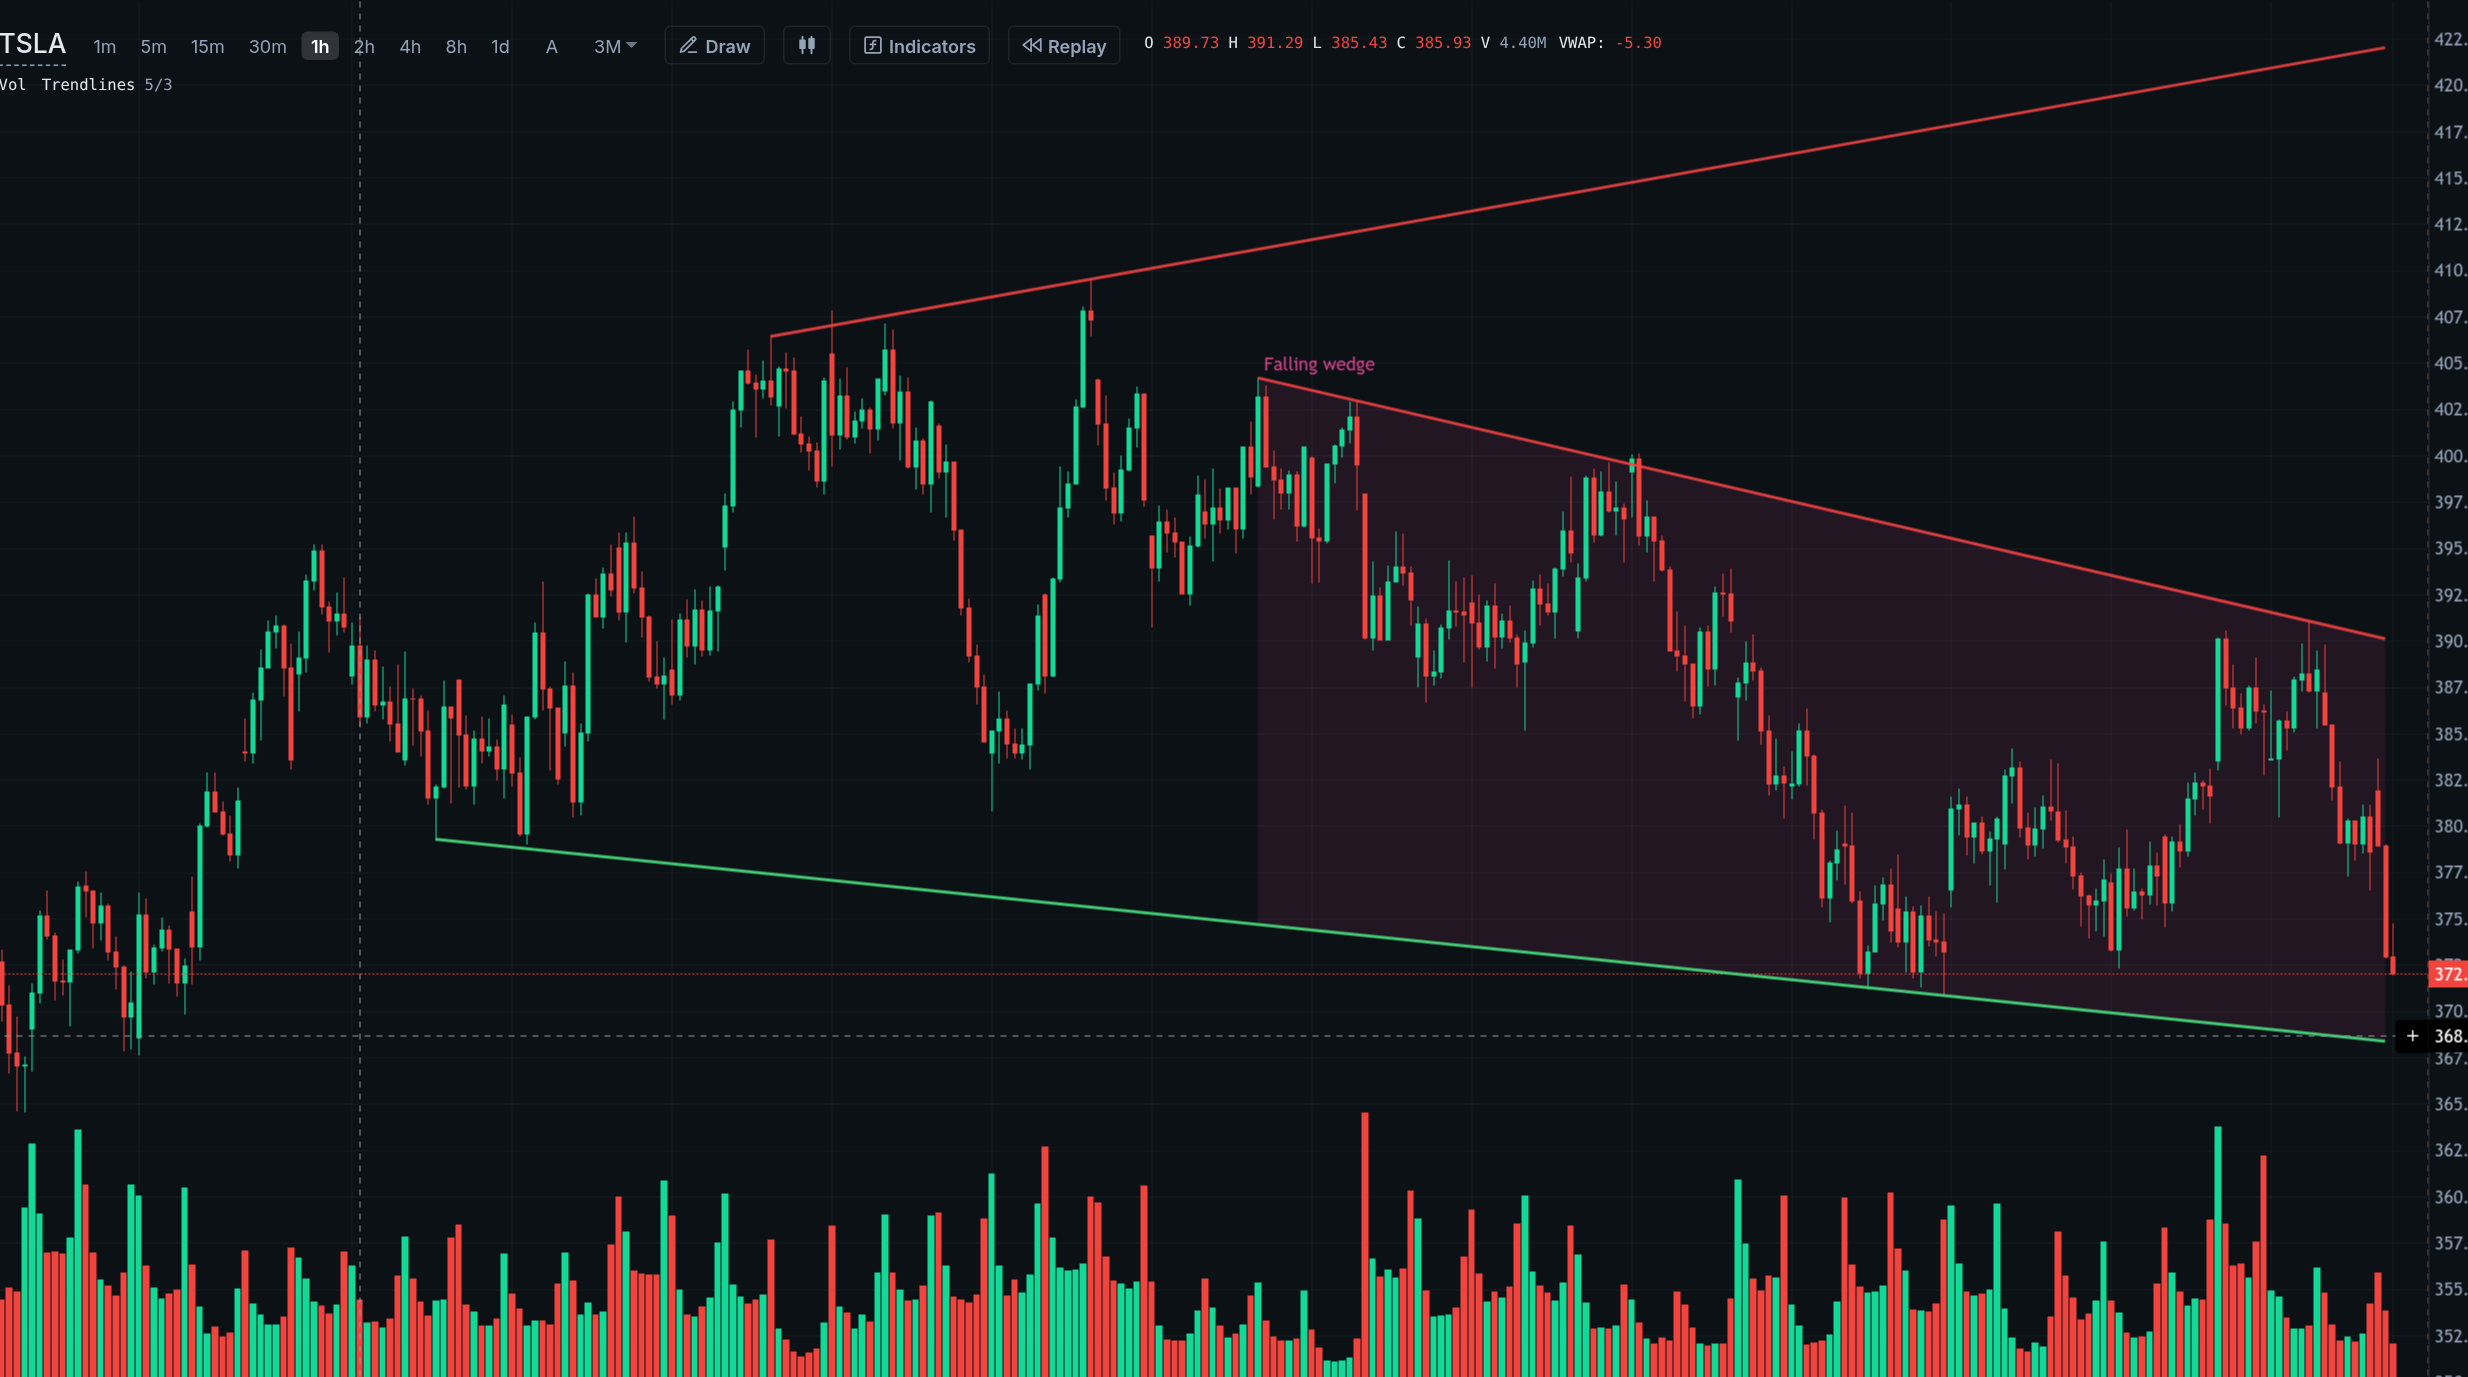
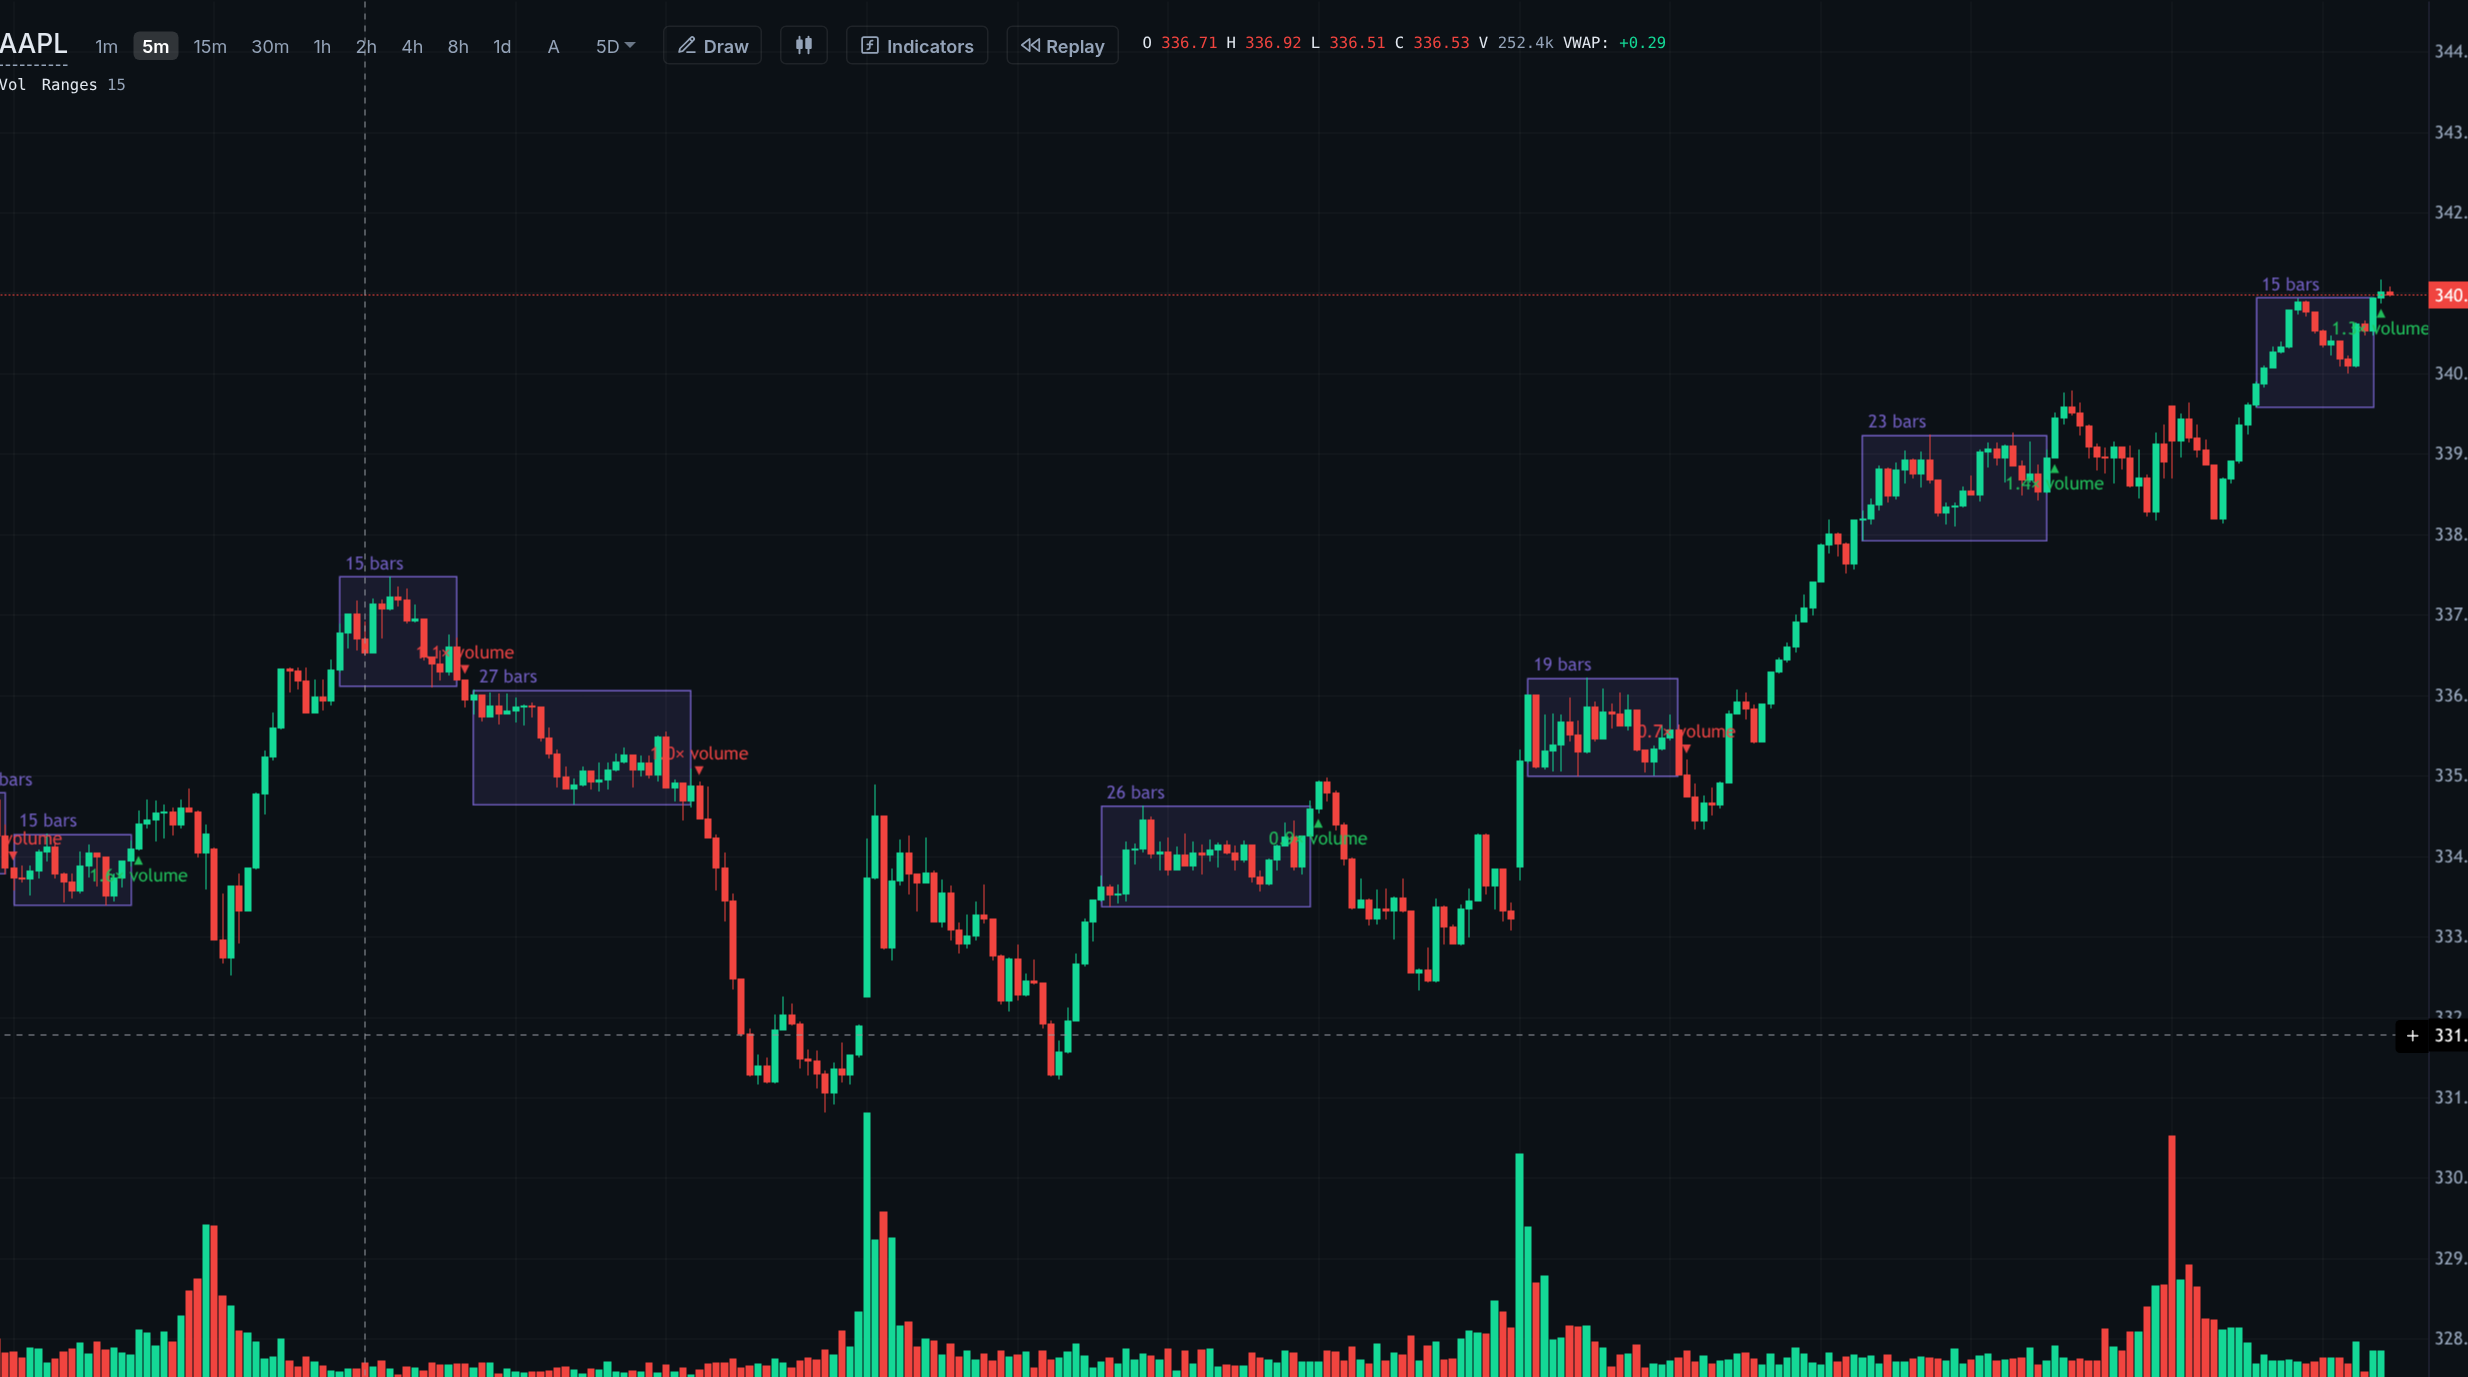
Automatic support and resistance zones, market-structure marks, trendlines, channels, wedges, consolidation ranges and volume levels. Each mark uses completed candles, so replay shows what was available at that point.
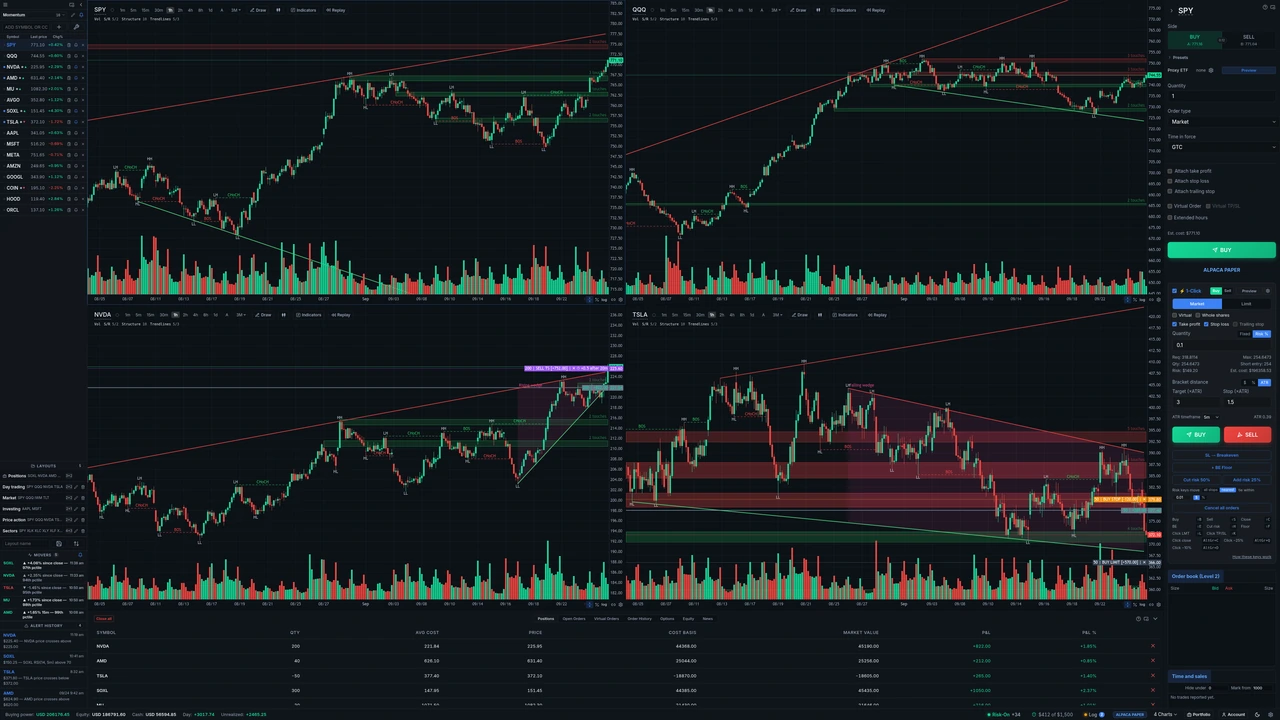
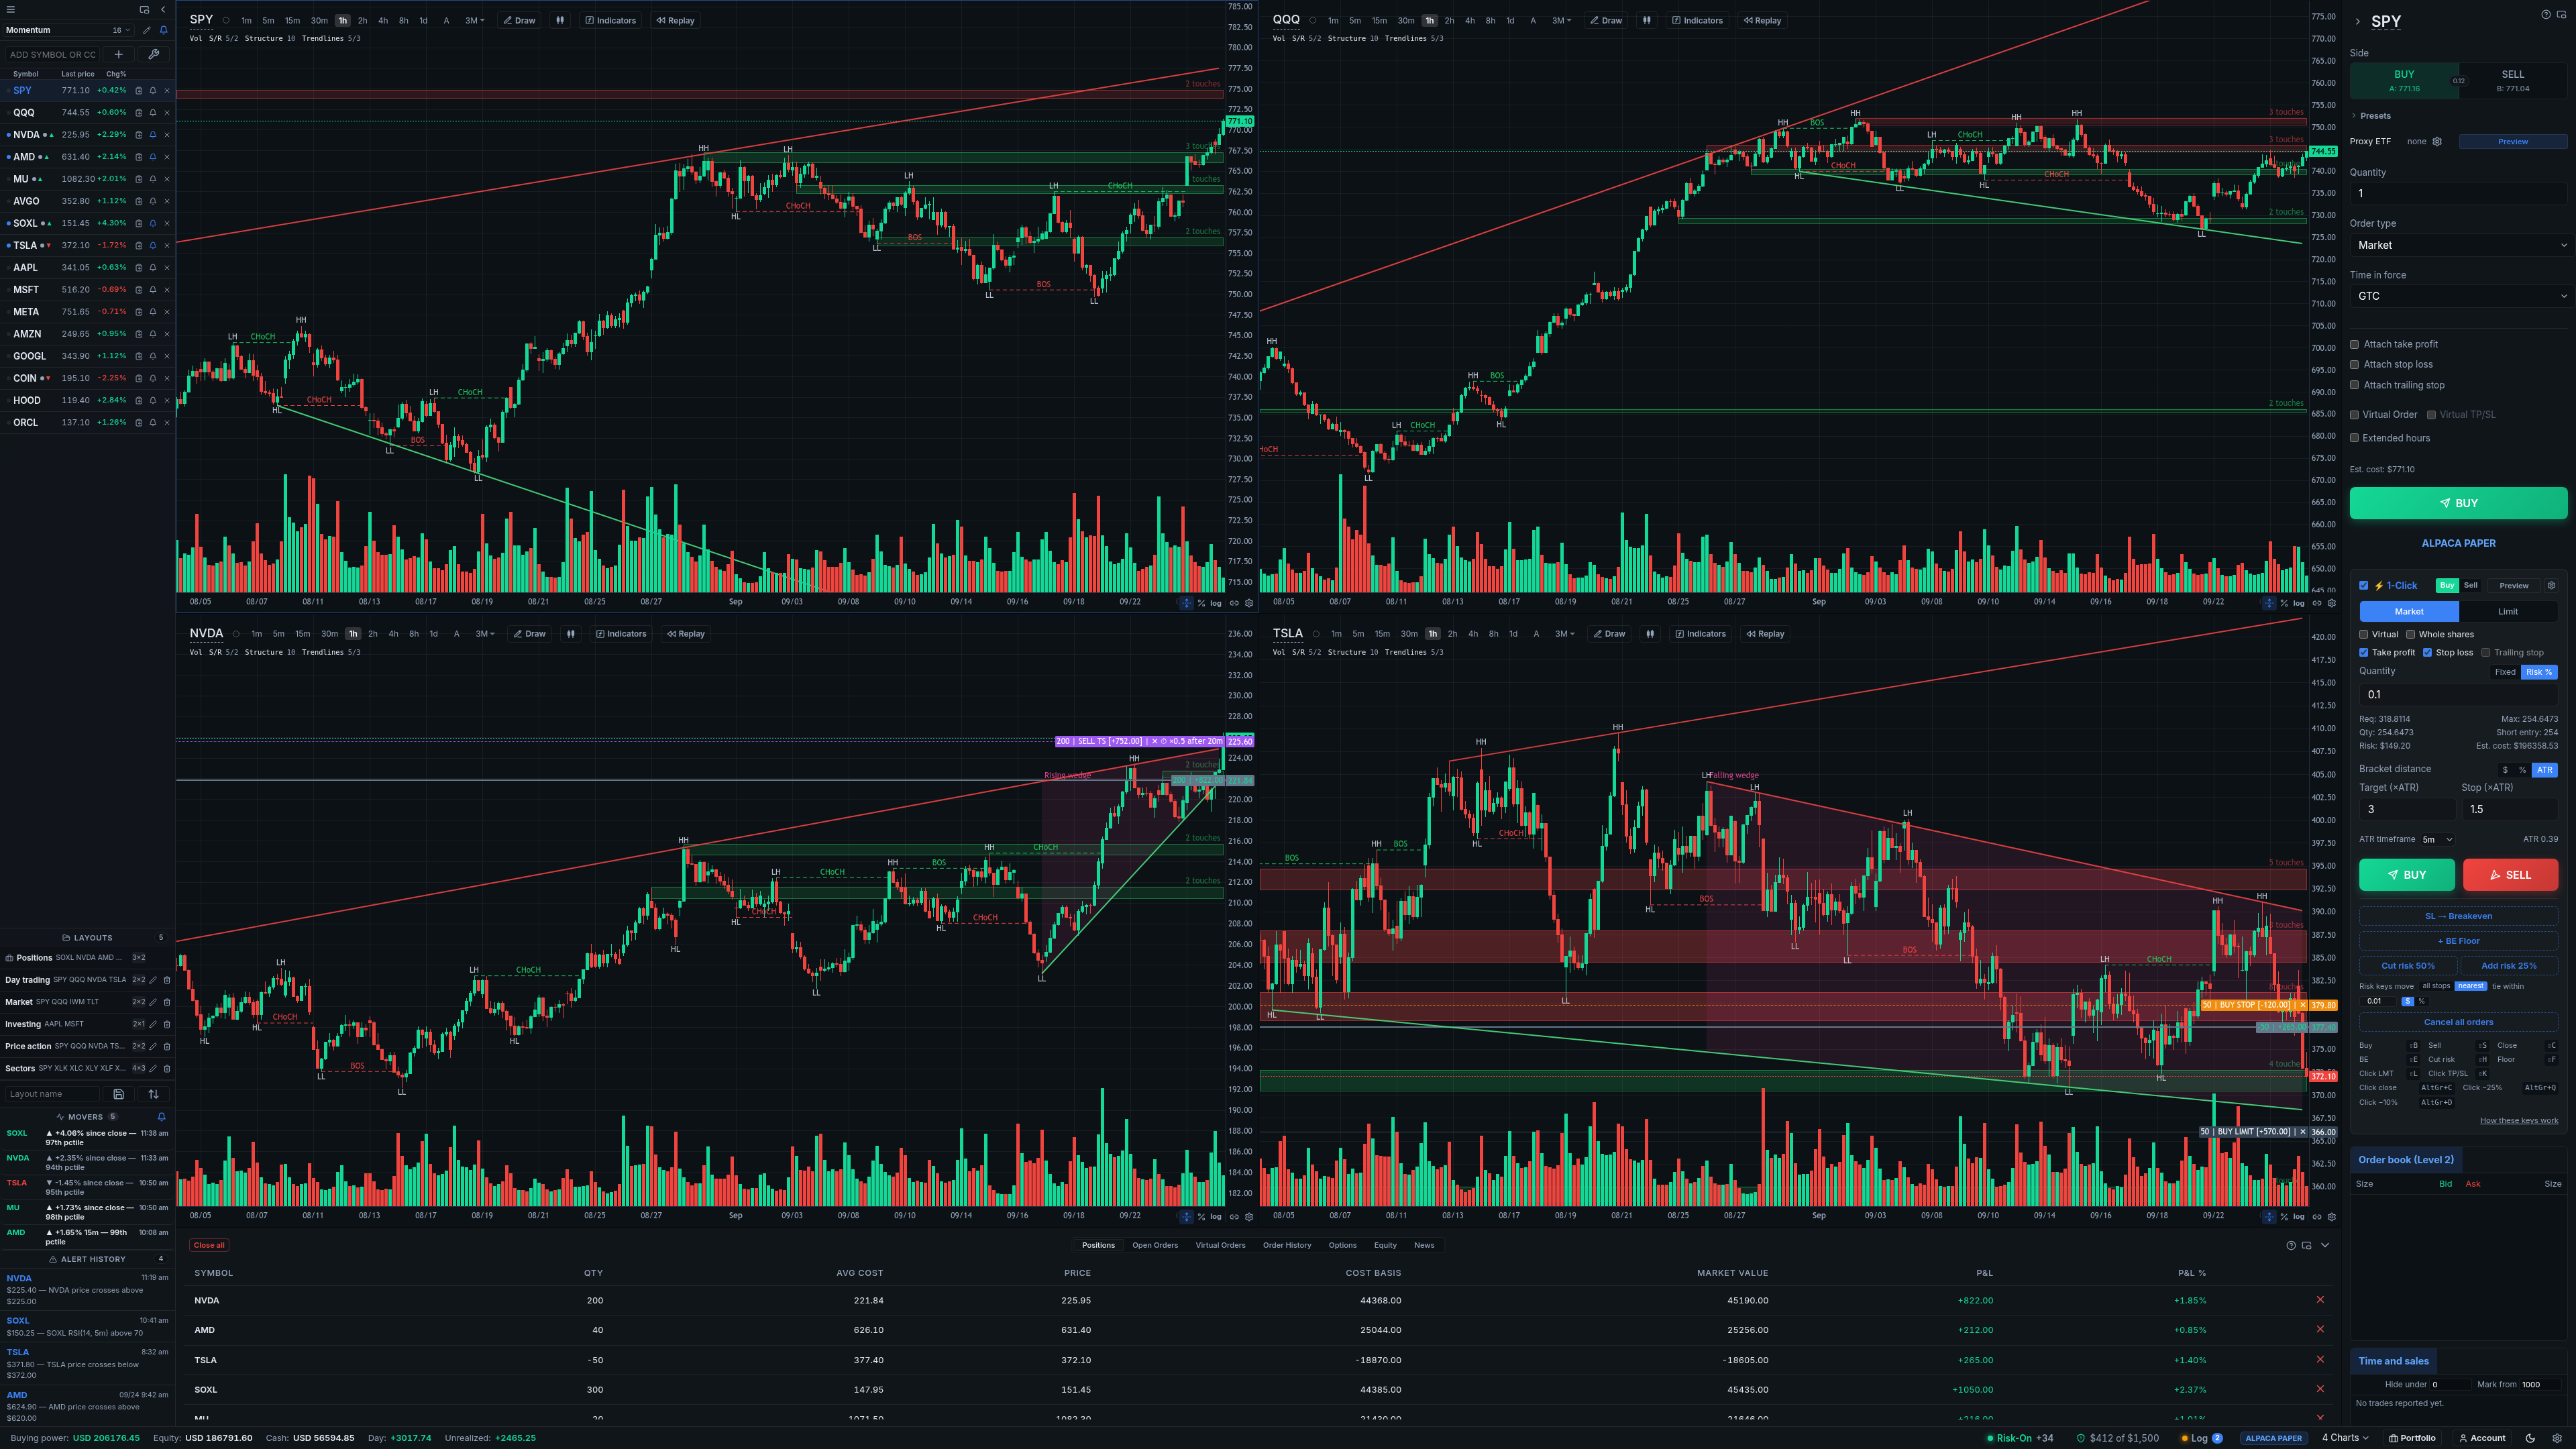
Momentum, volume and volatility in panes
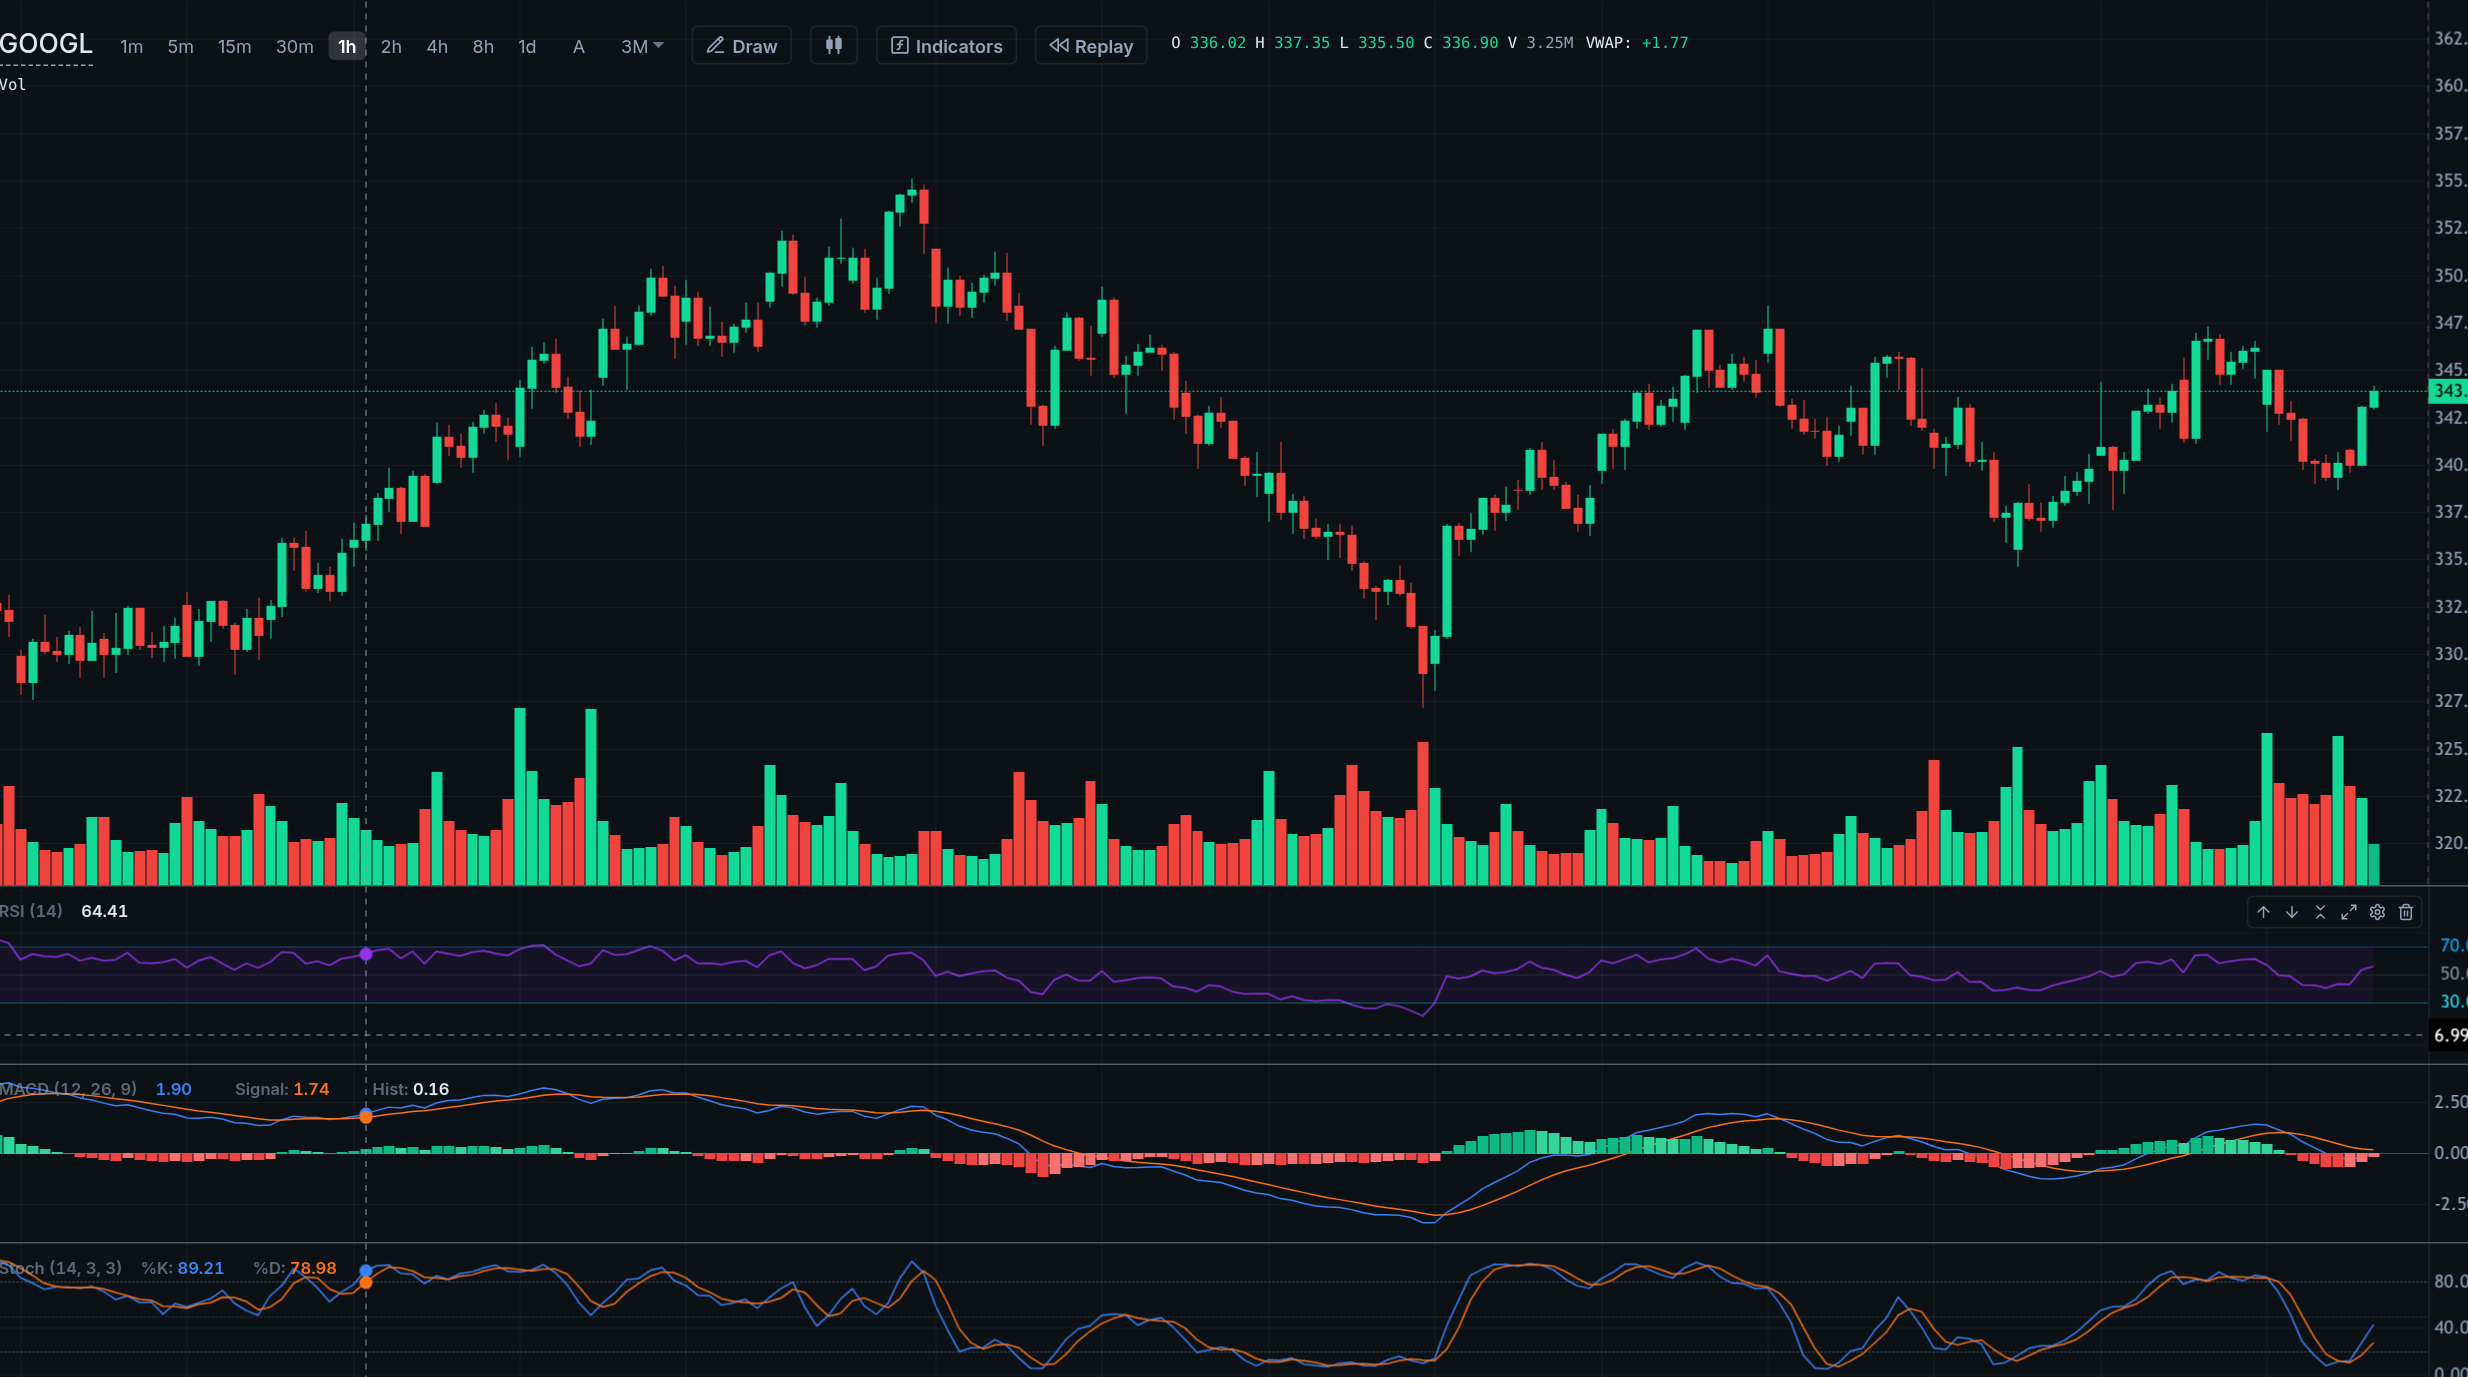
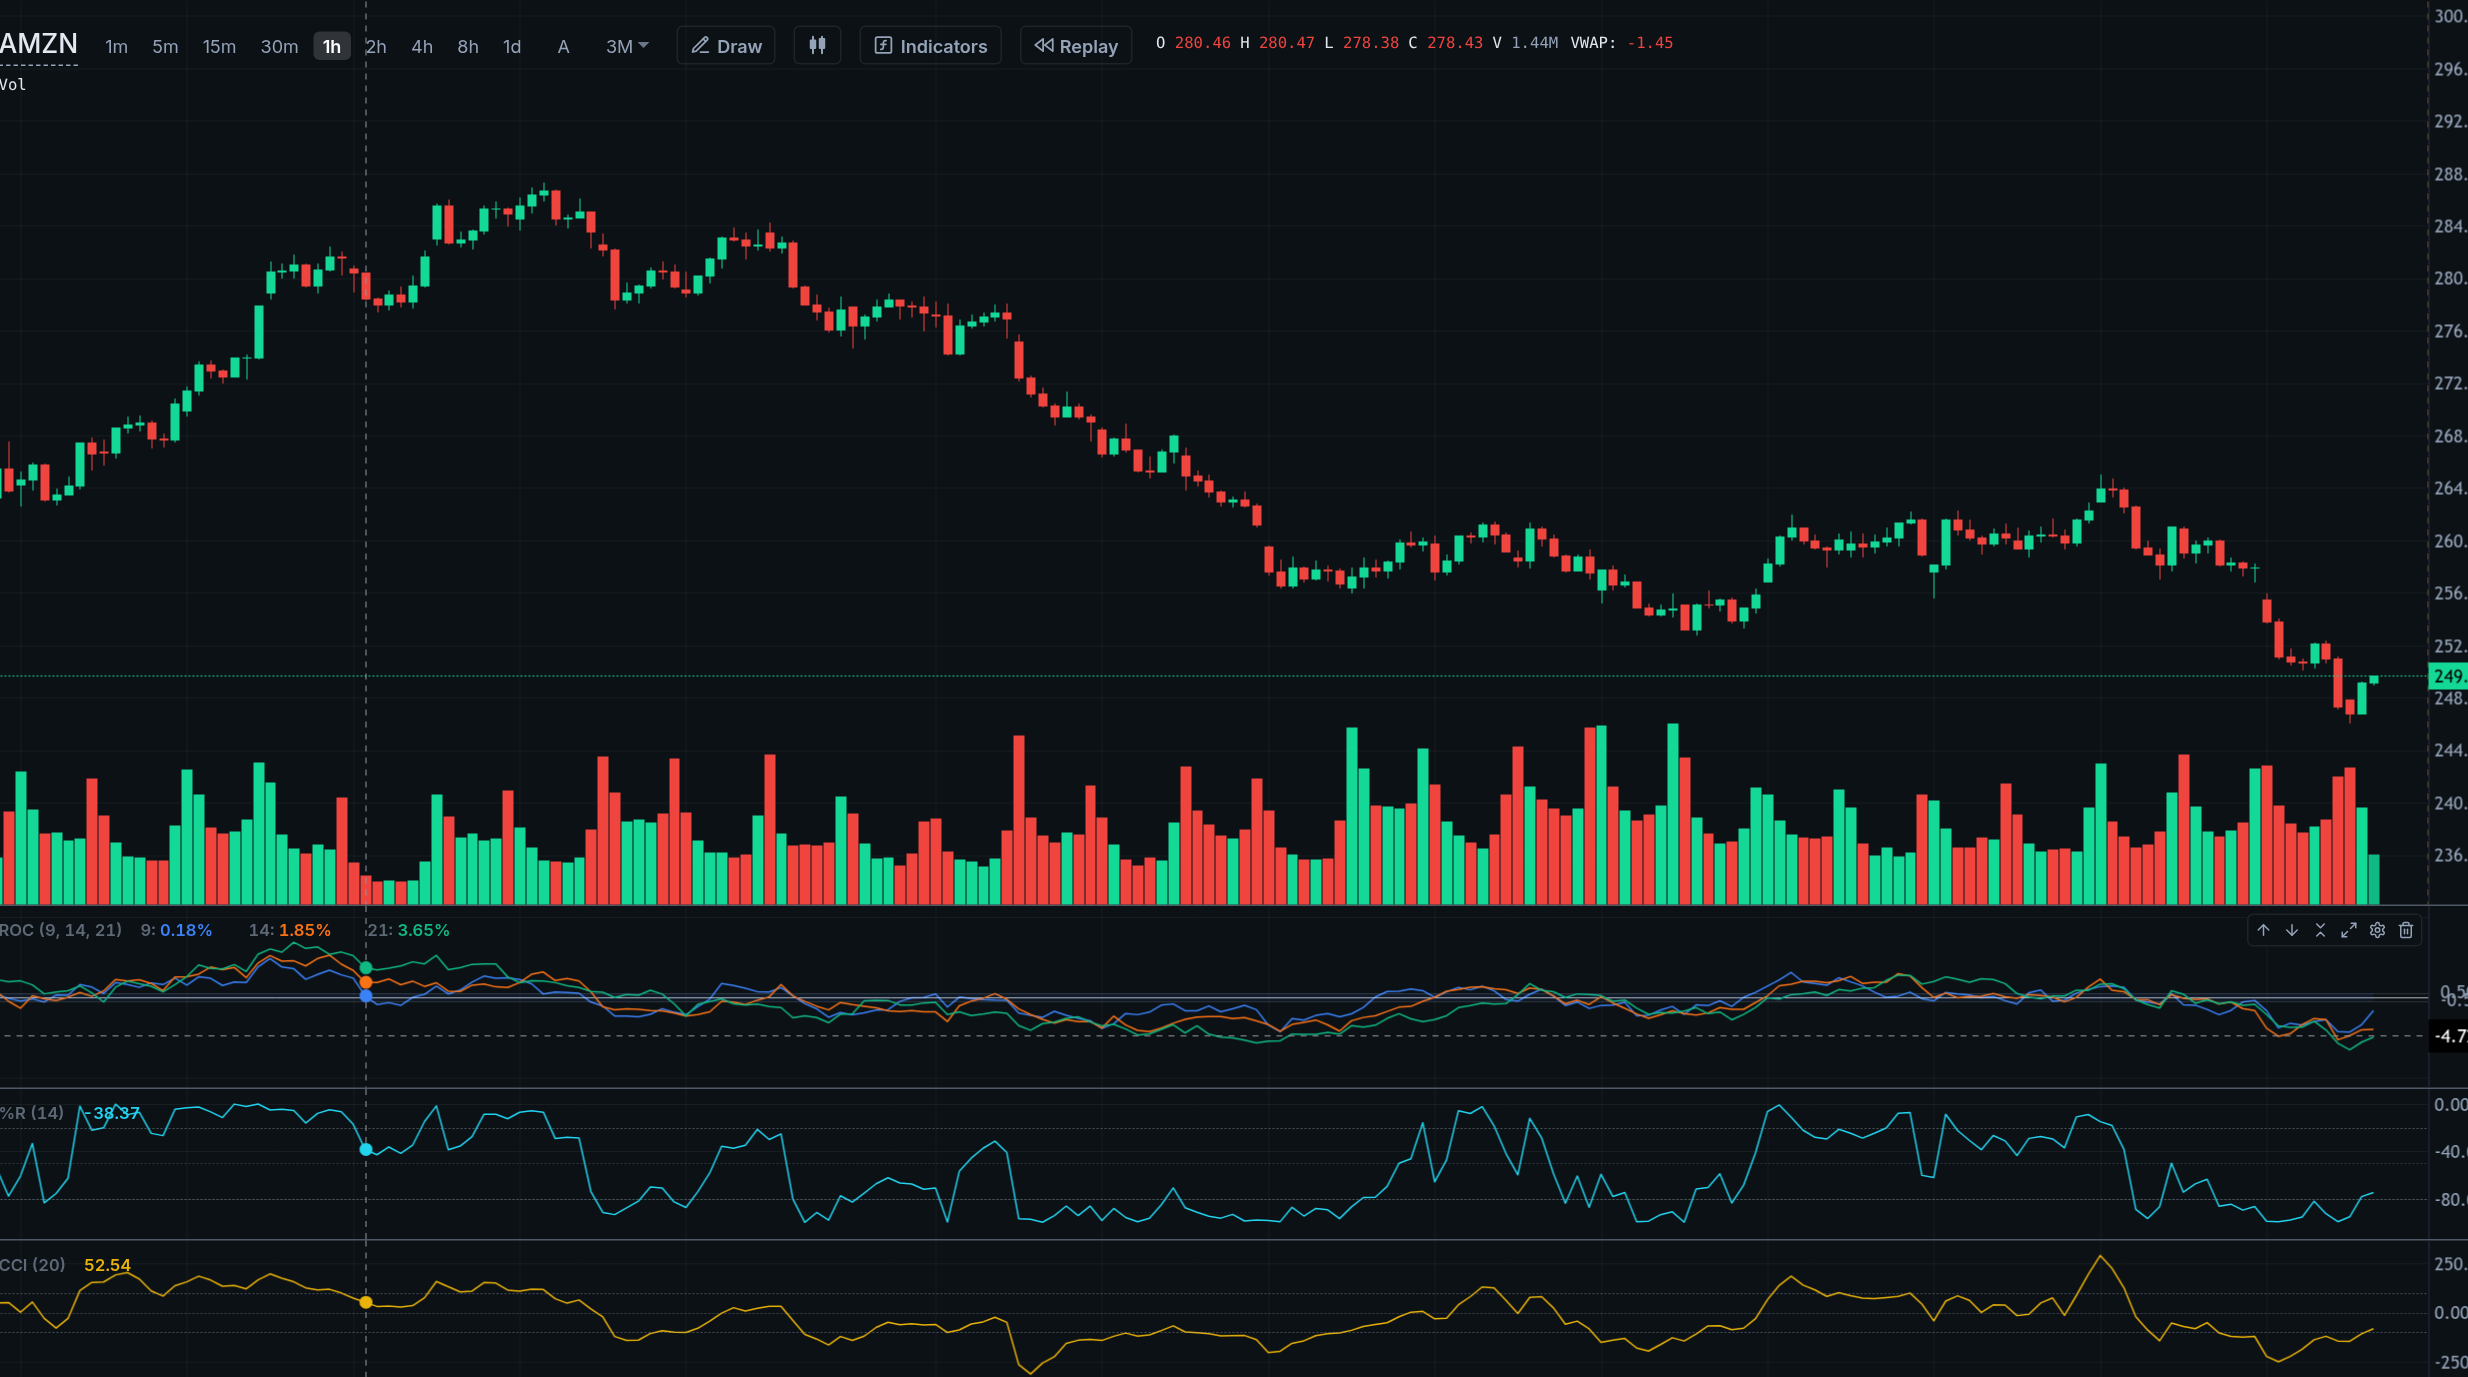
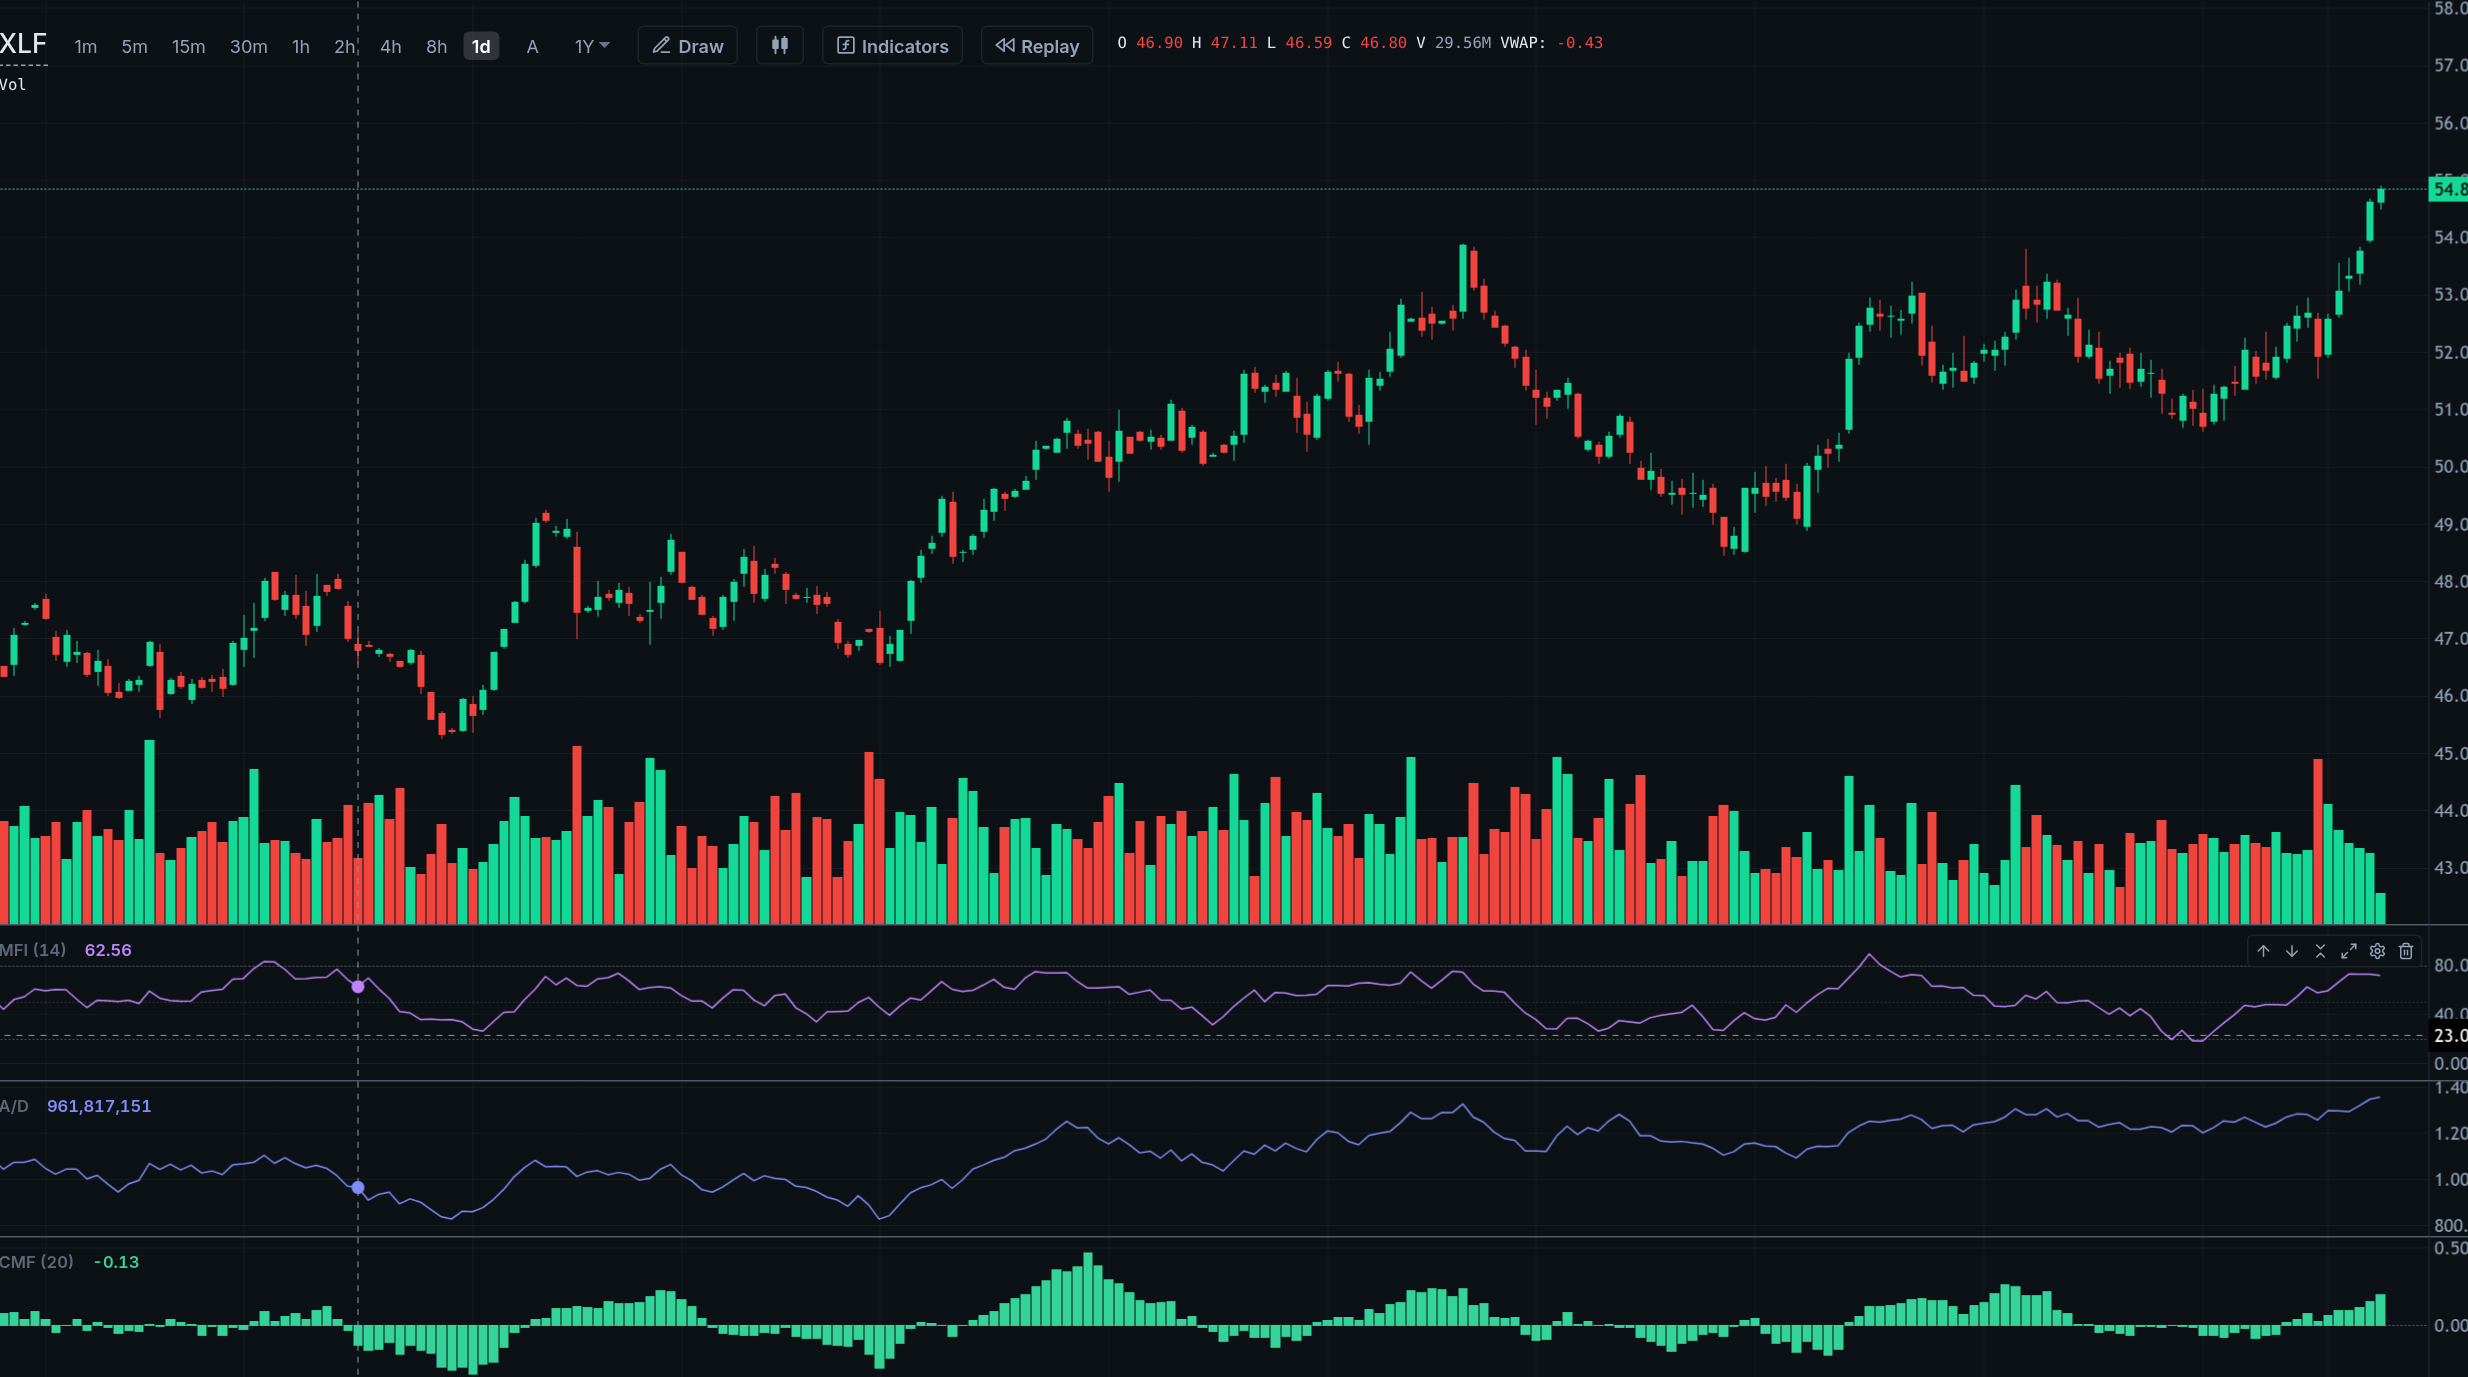
Add indicator panes, then resize, reorder, minimize or move them above the candles. Set pane layouts separately for each chart.
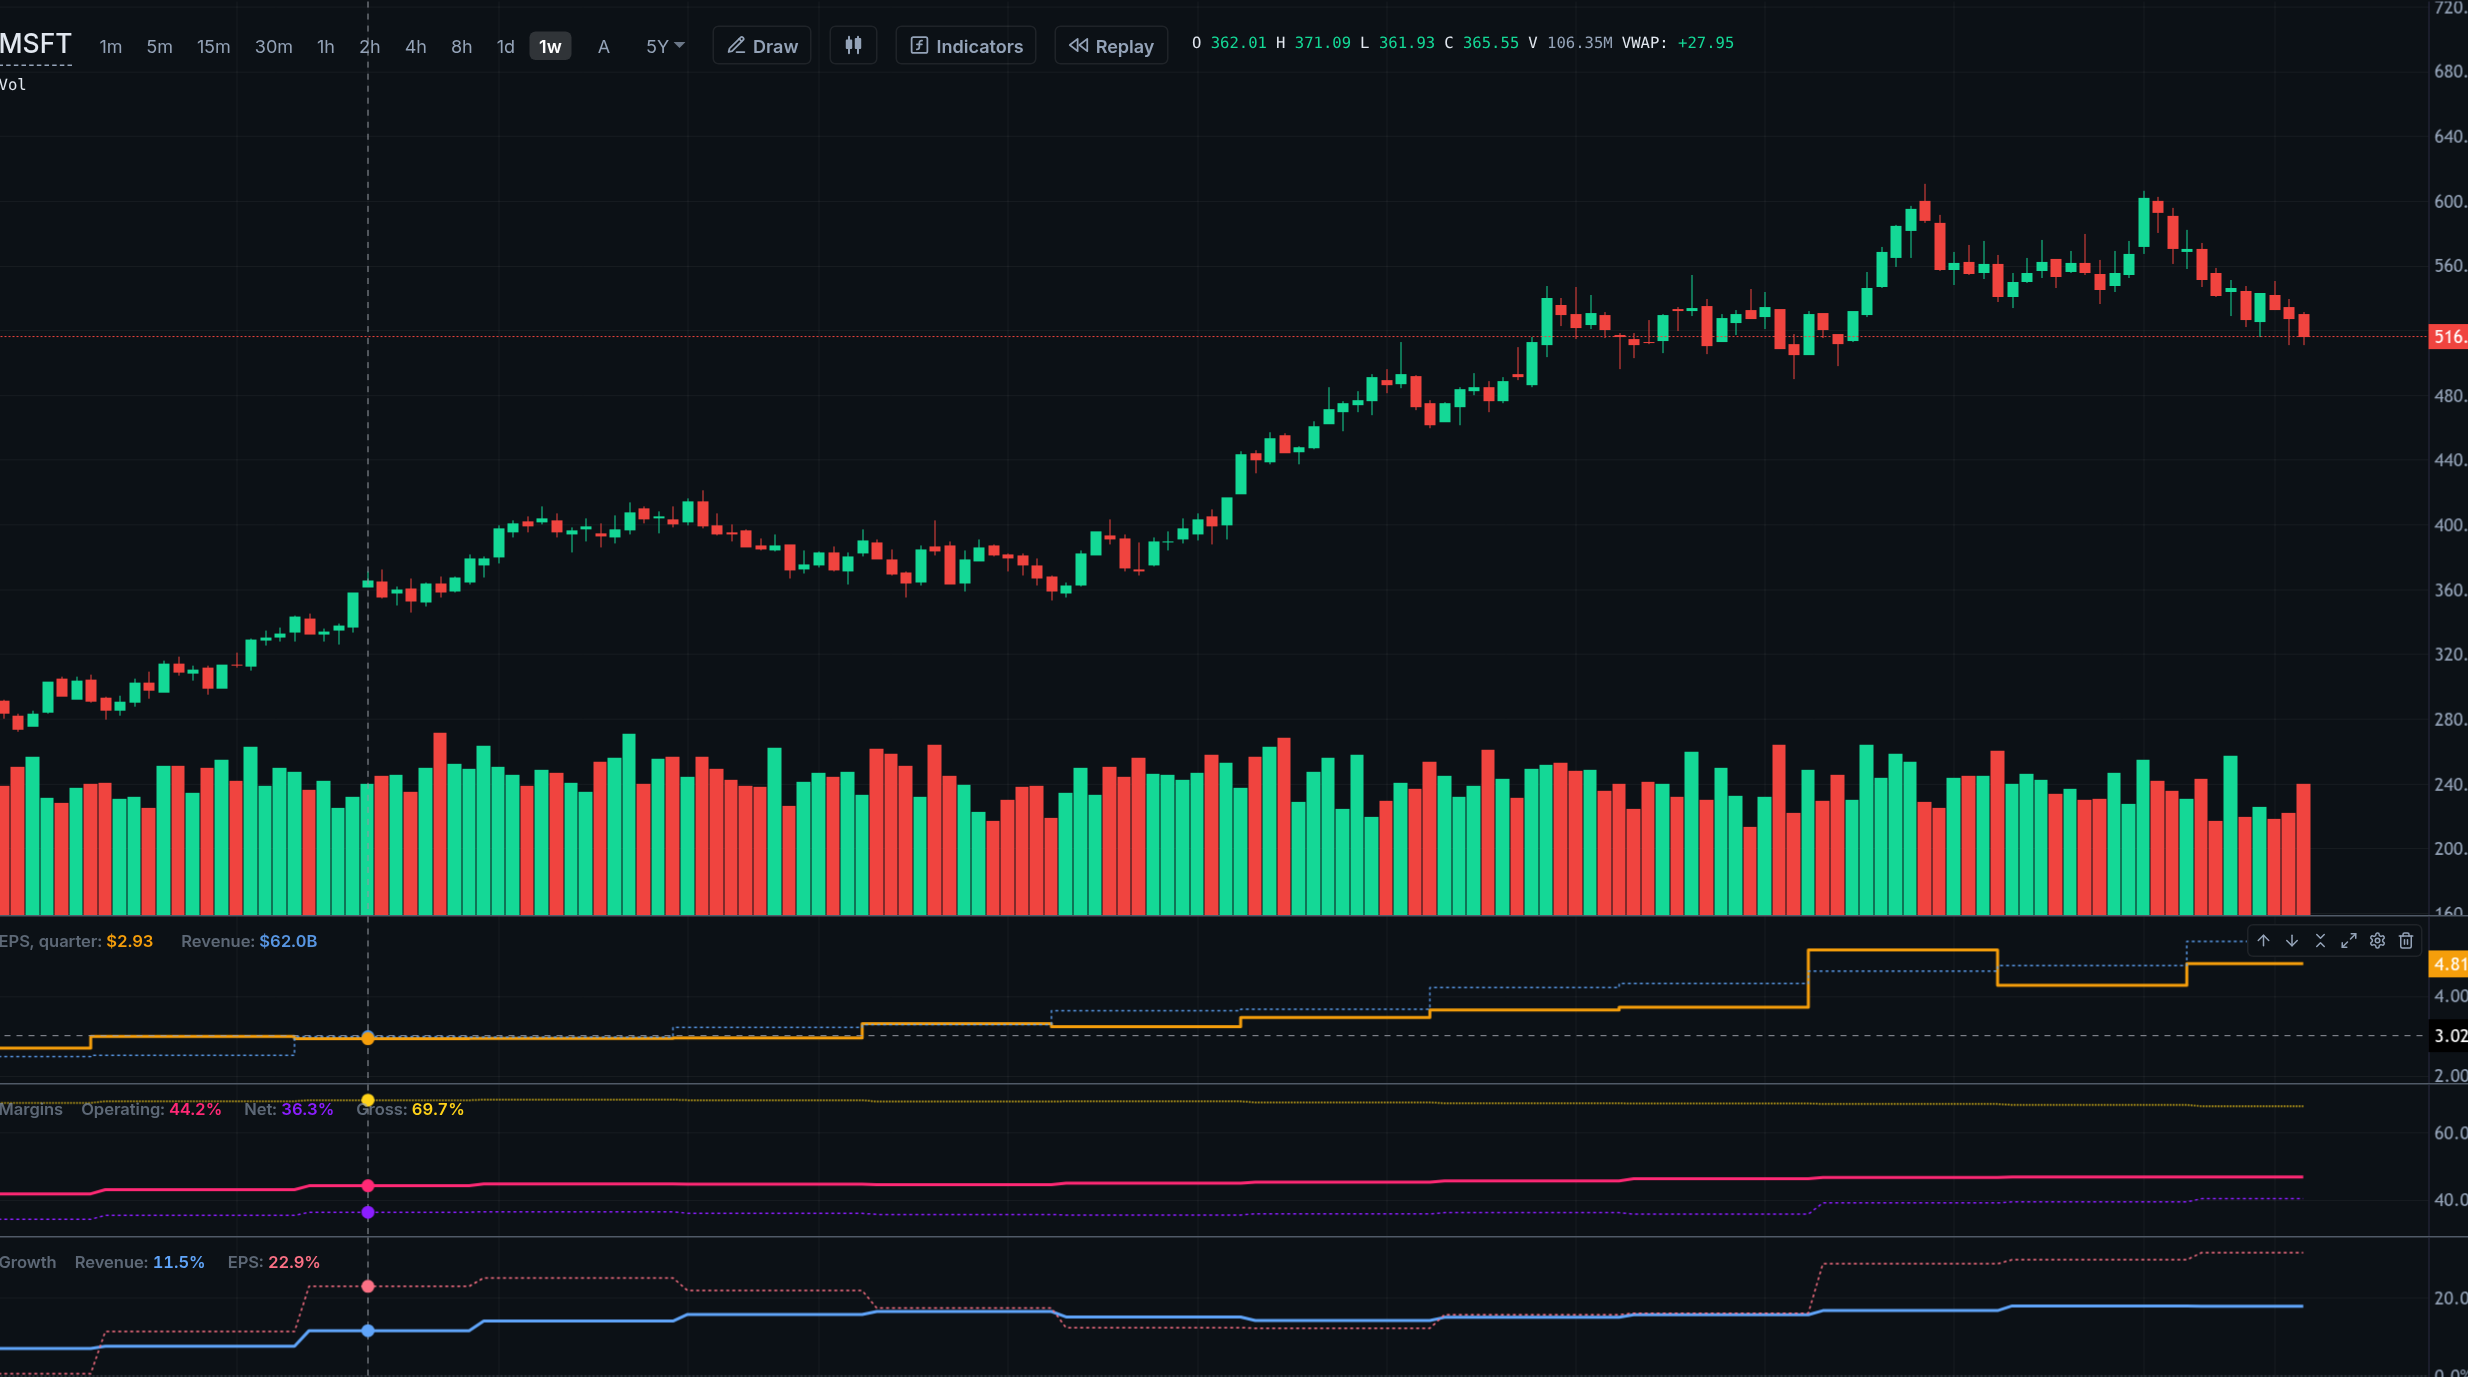
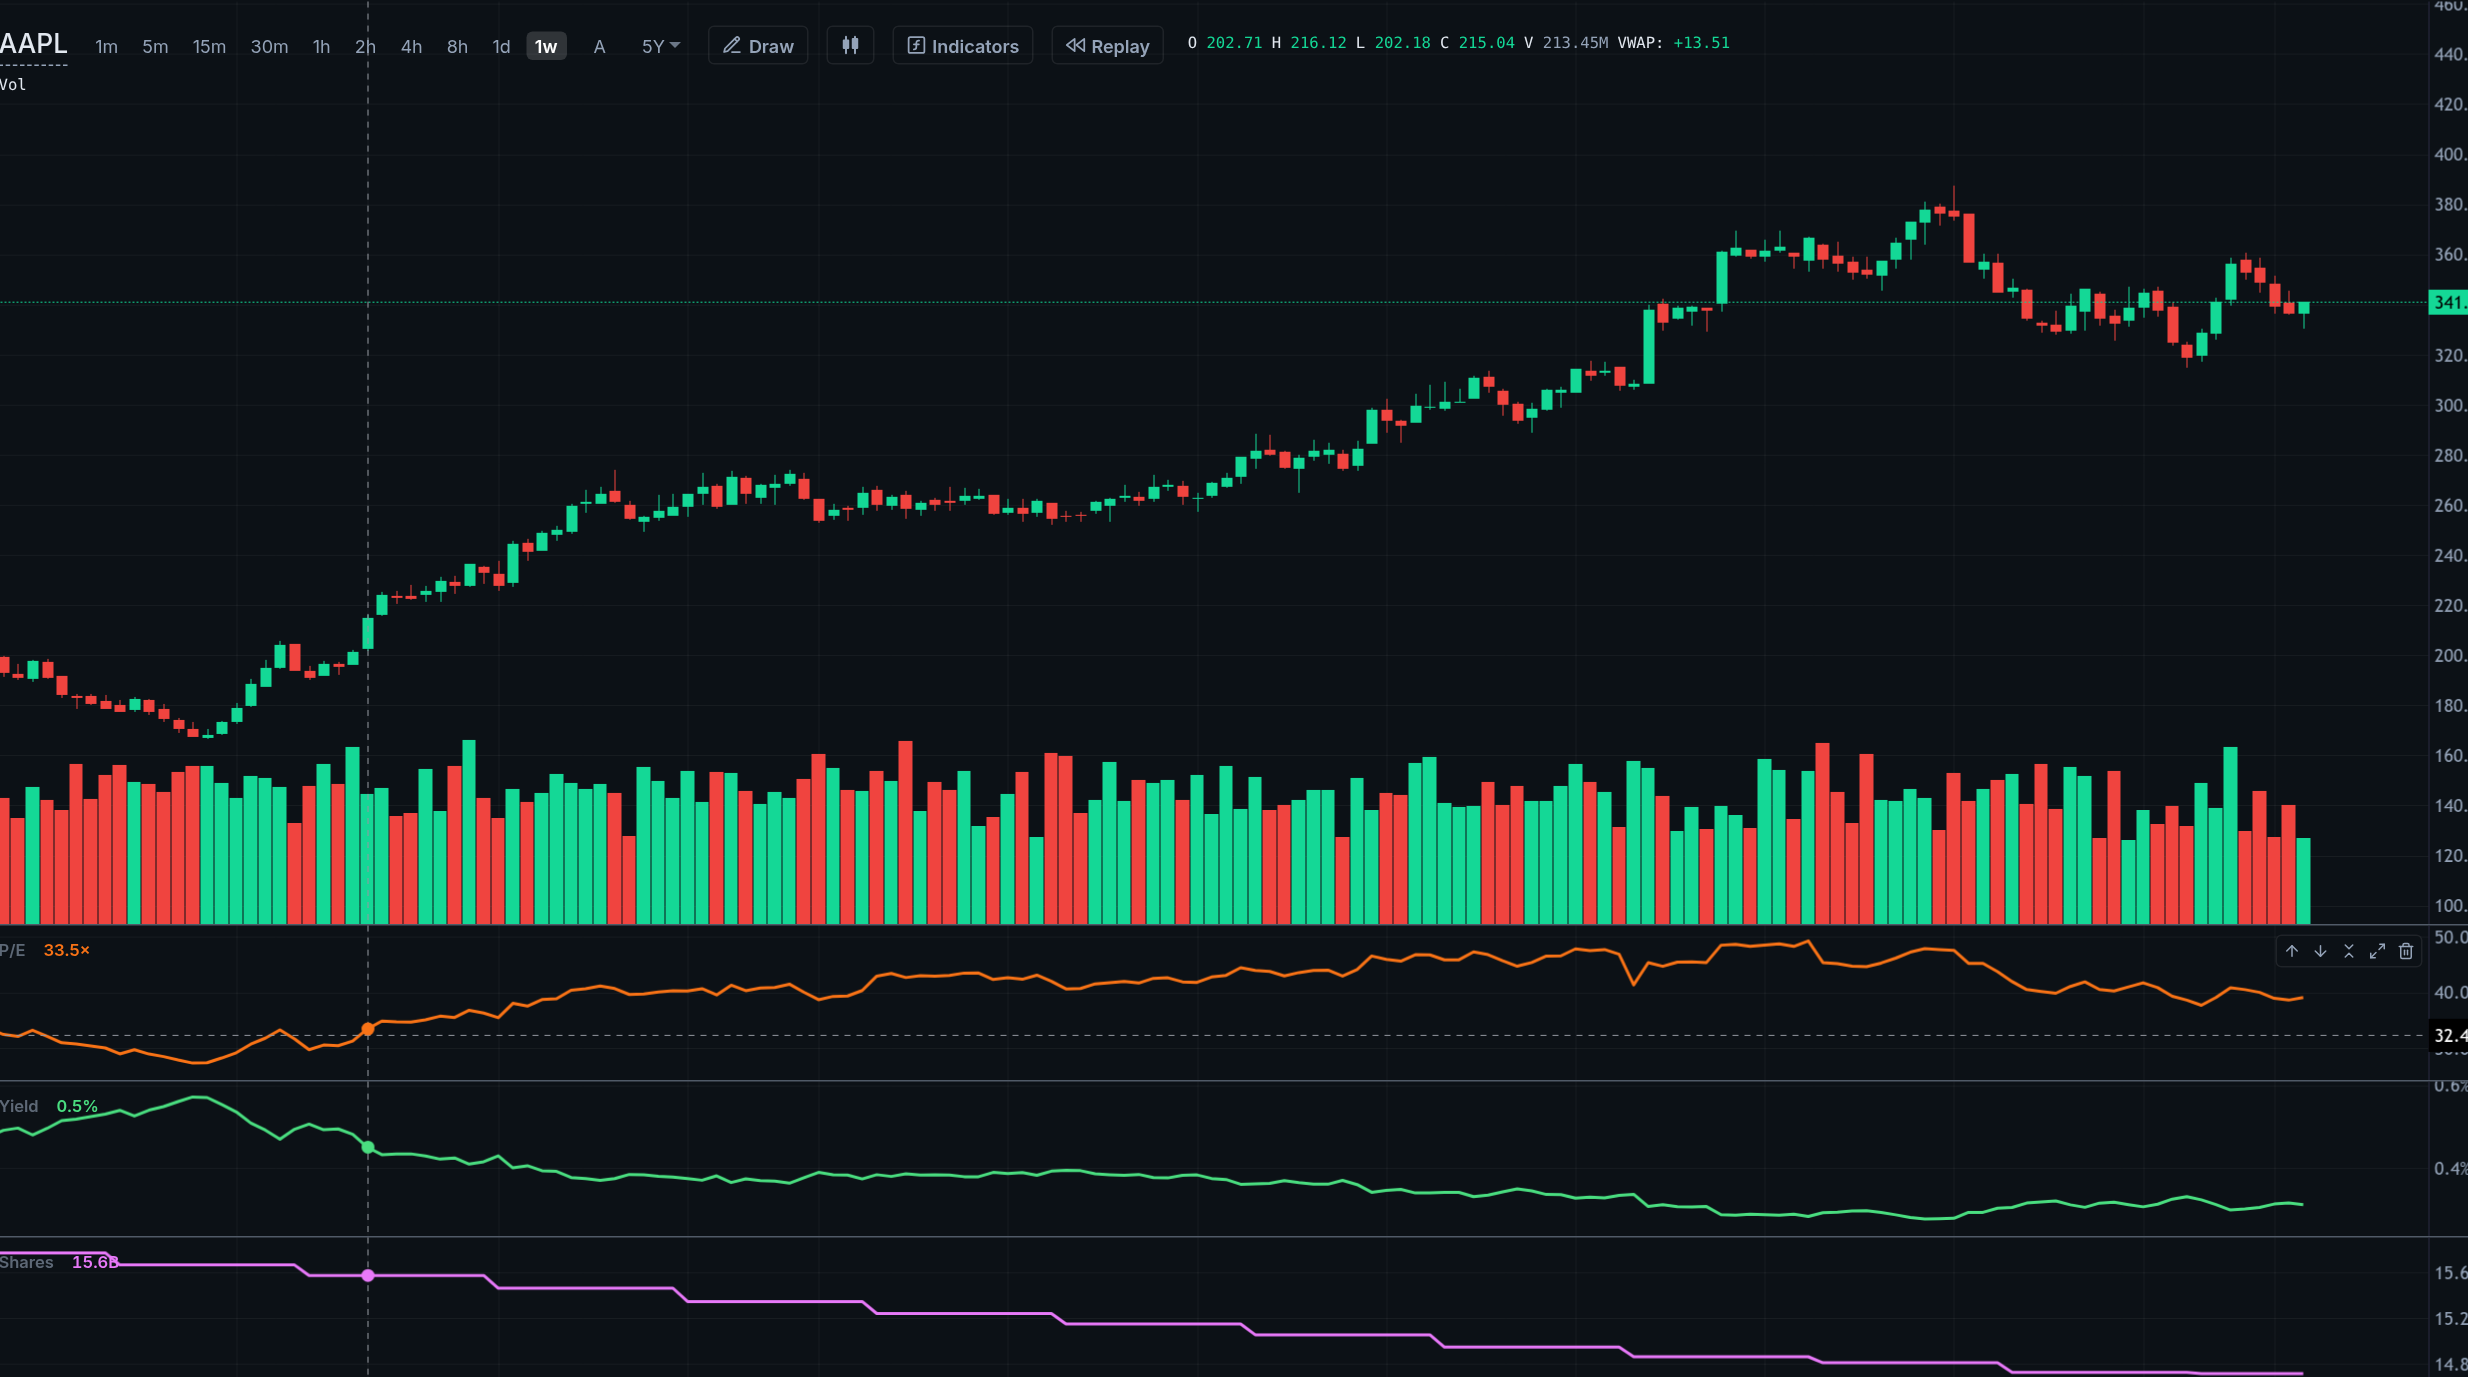
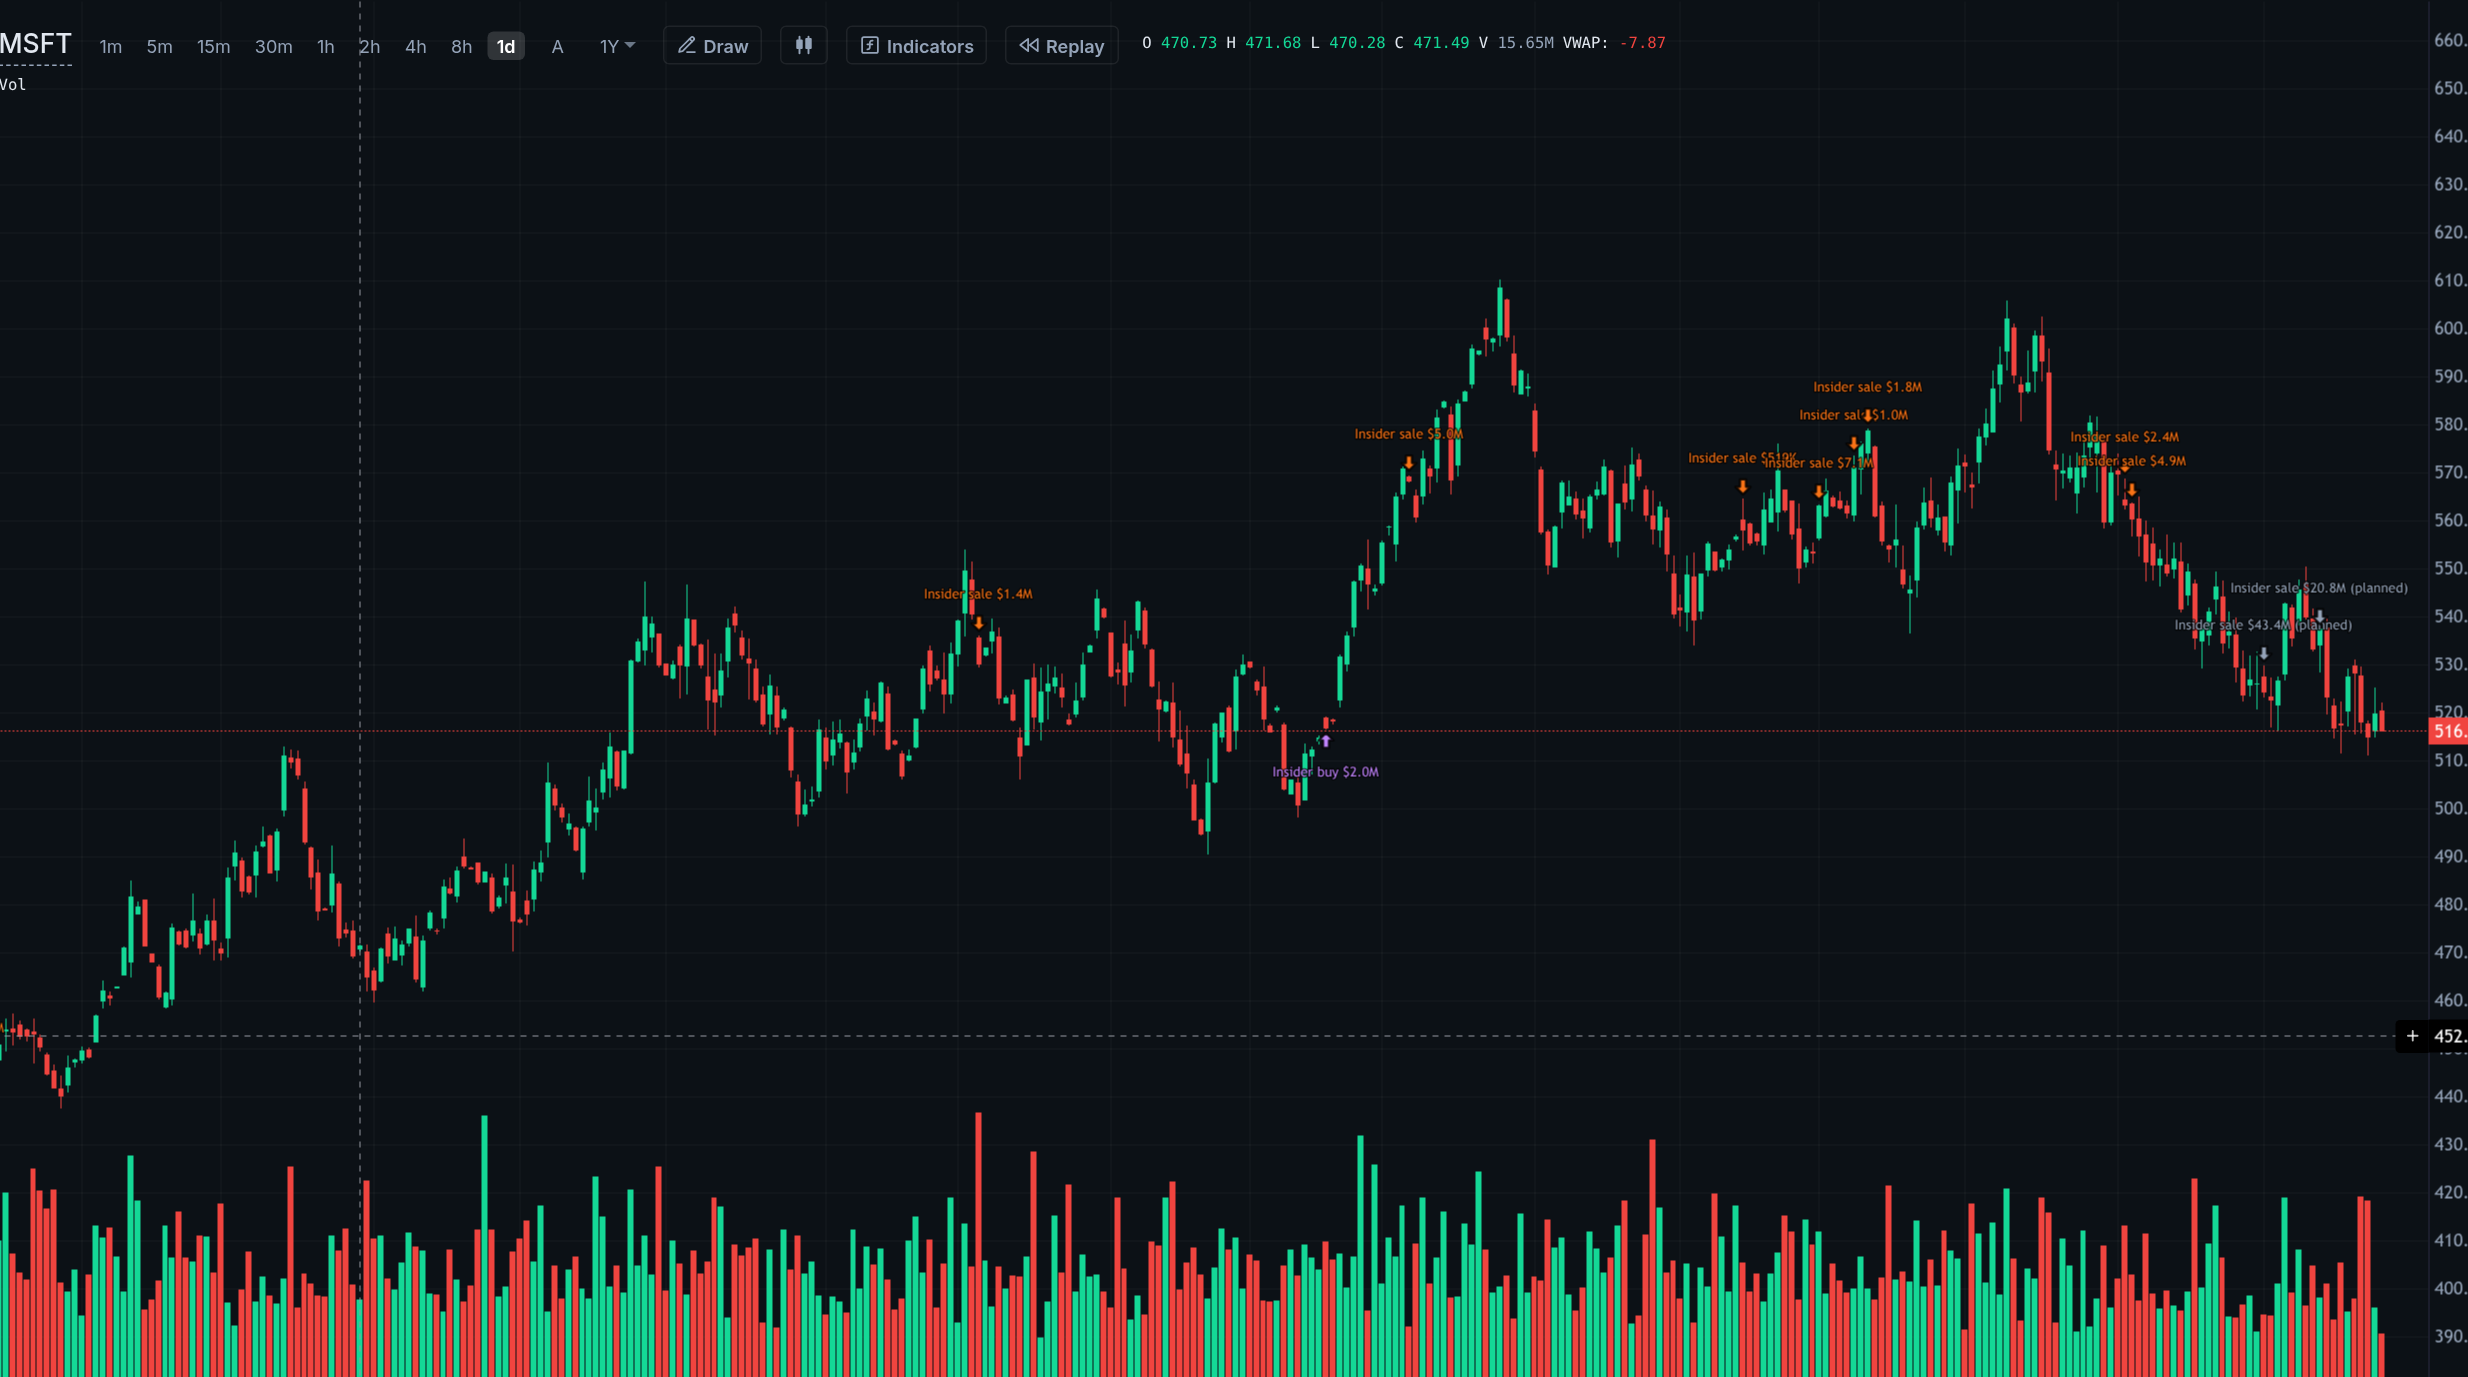
Earnings, valuation and insiders beside the price
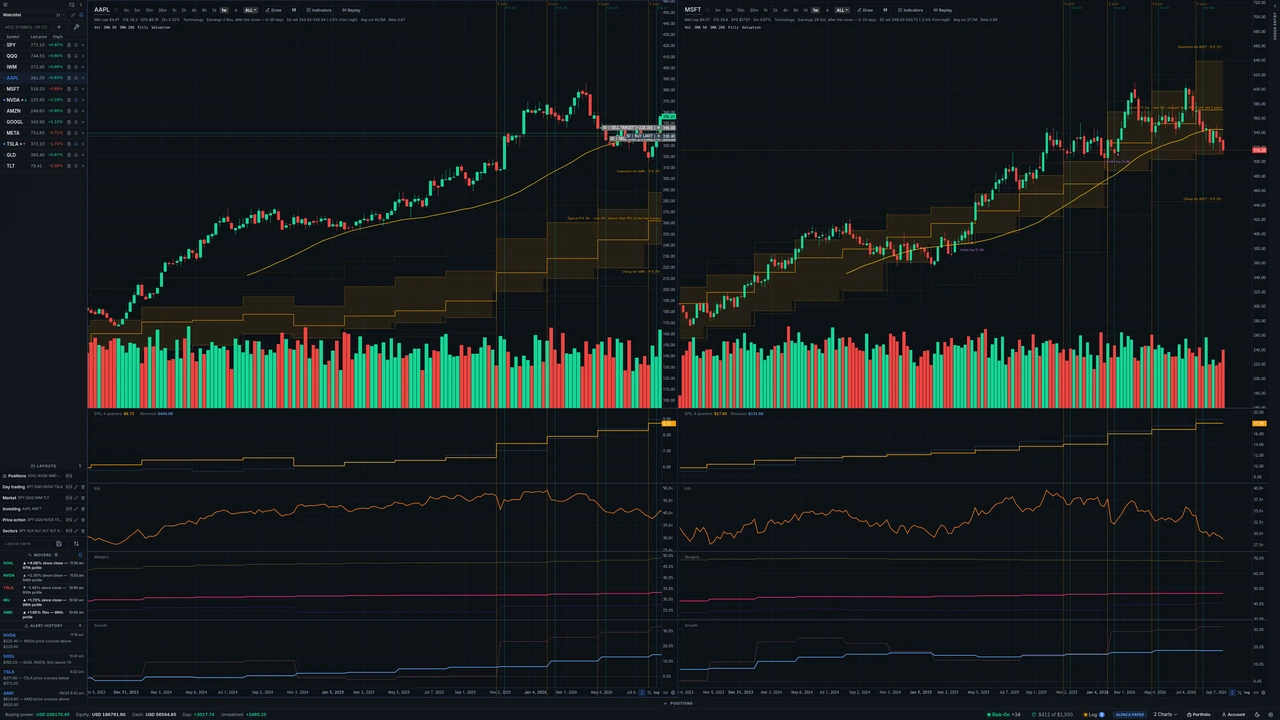
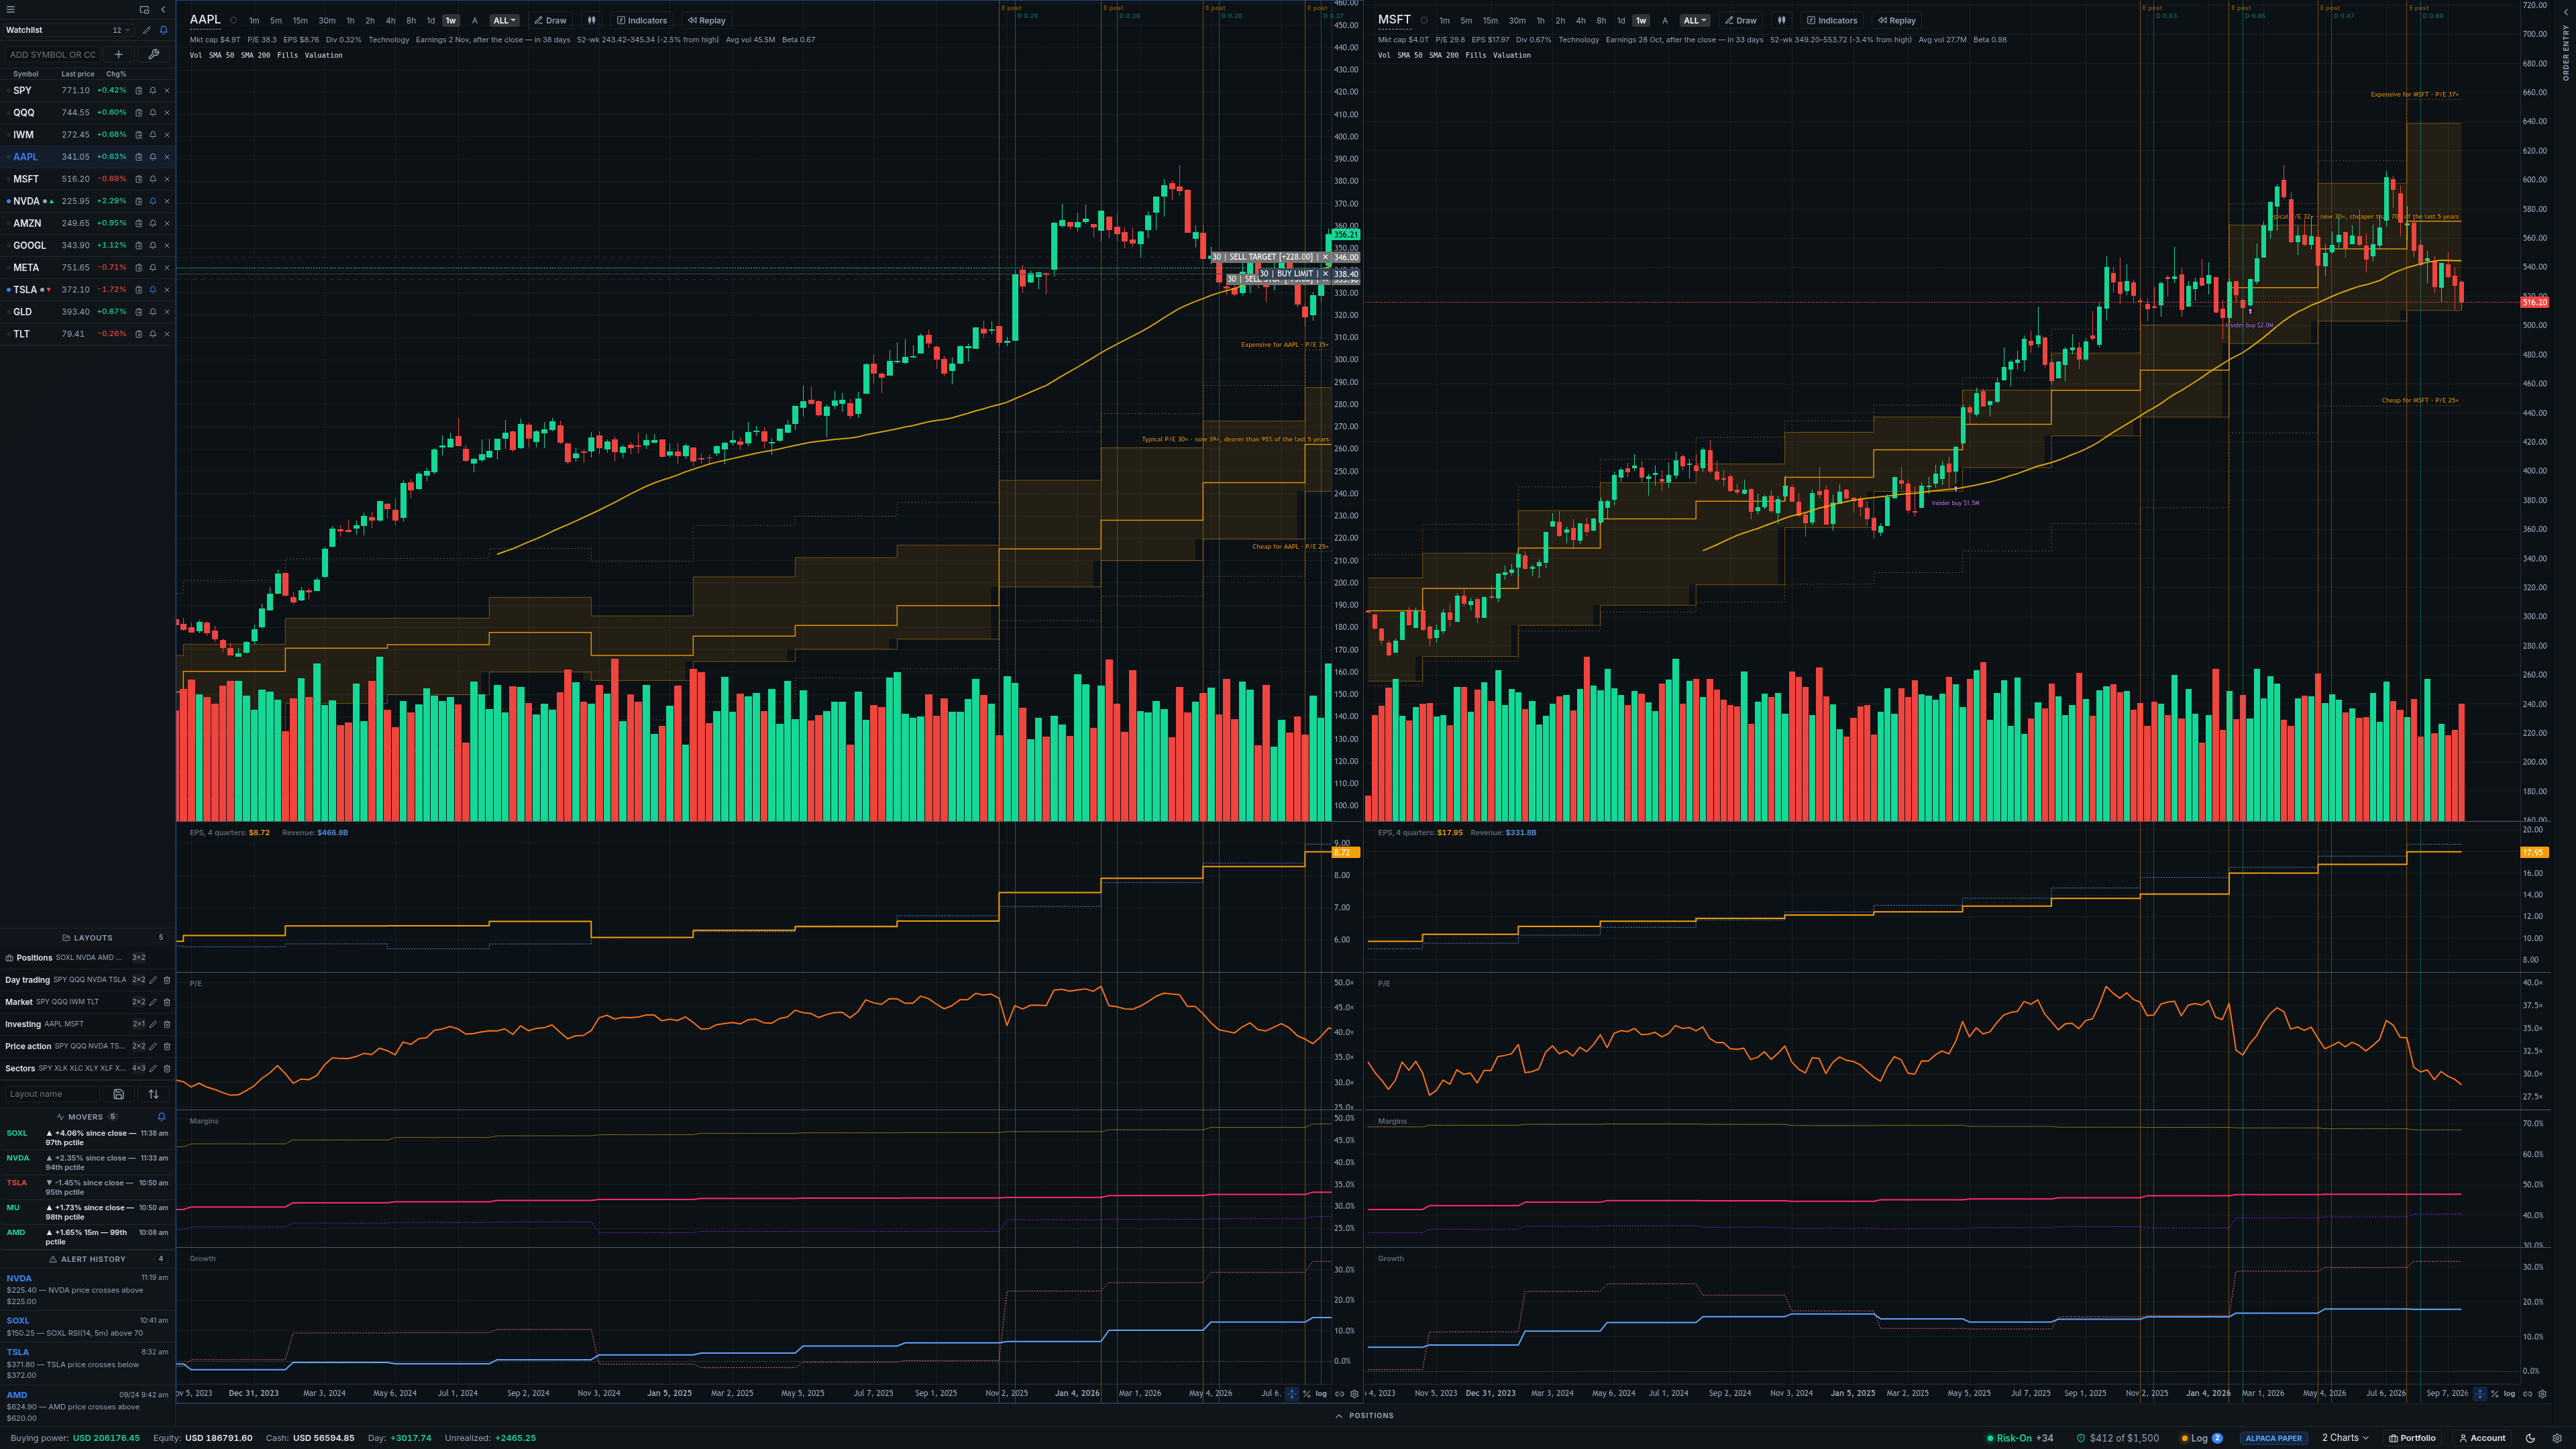
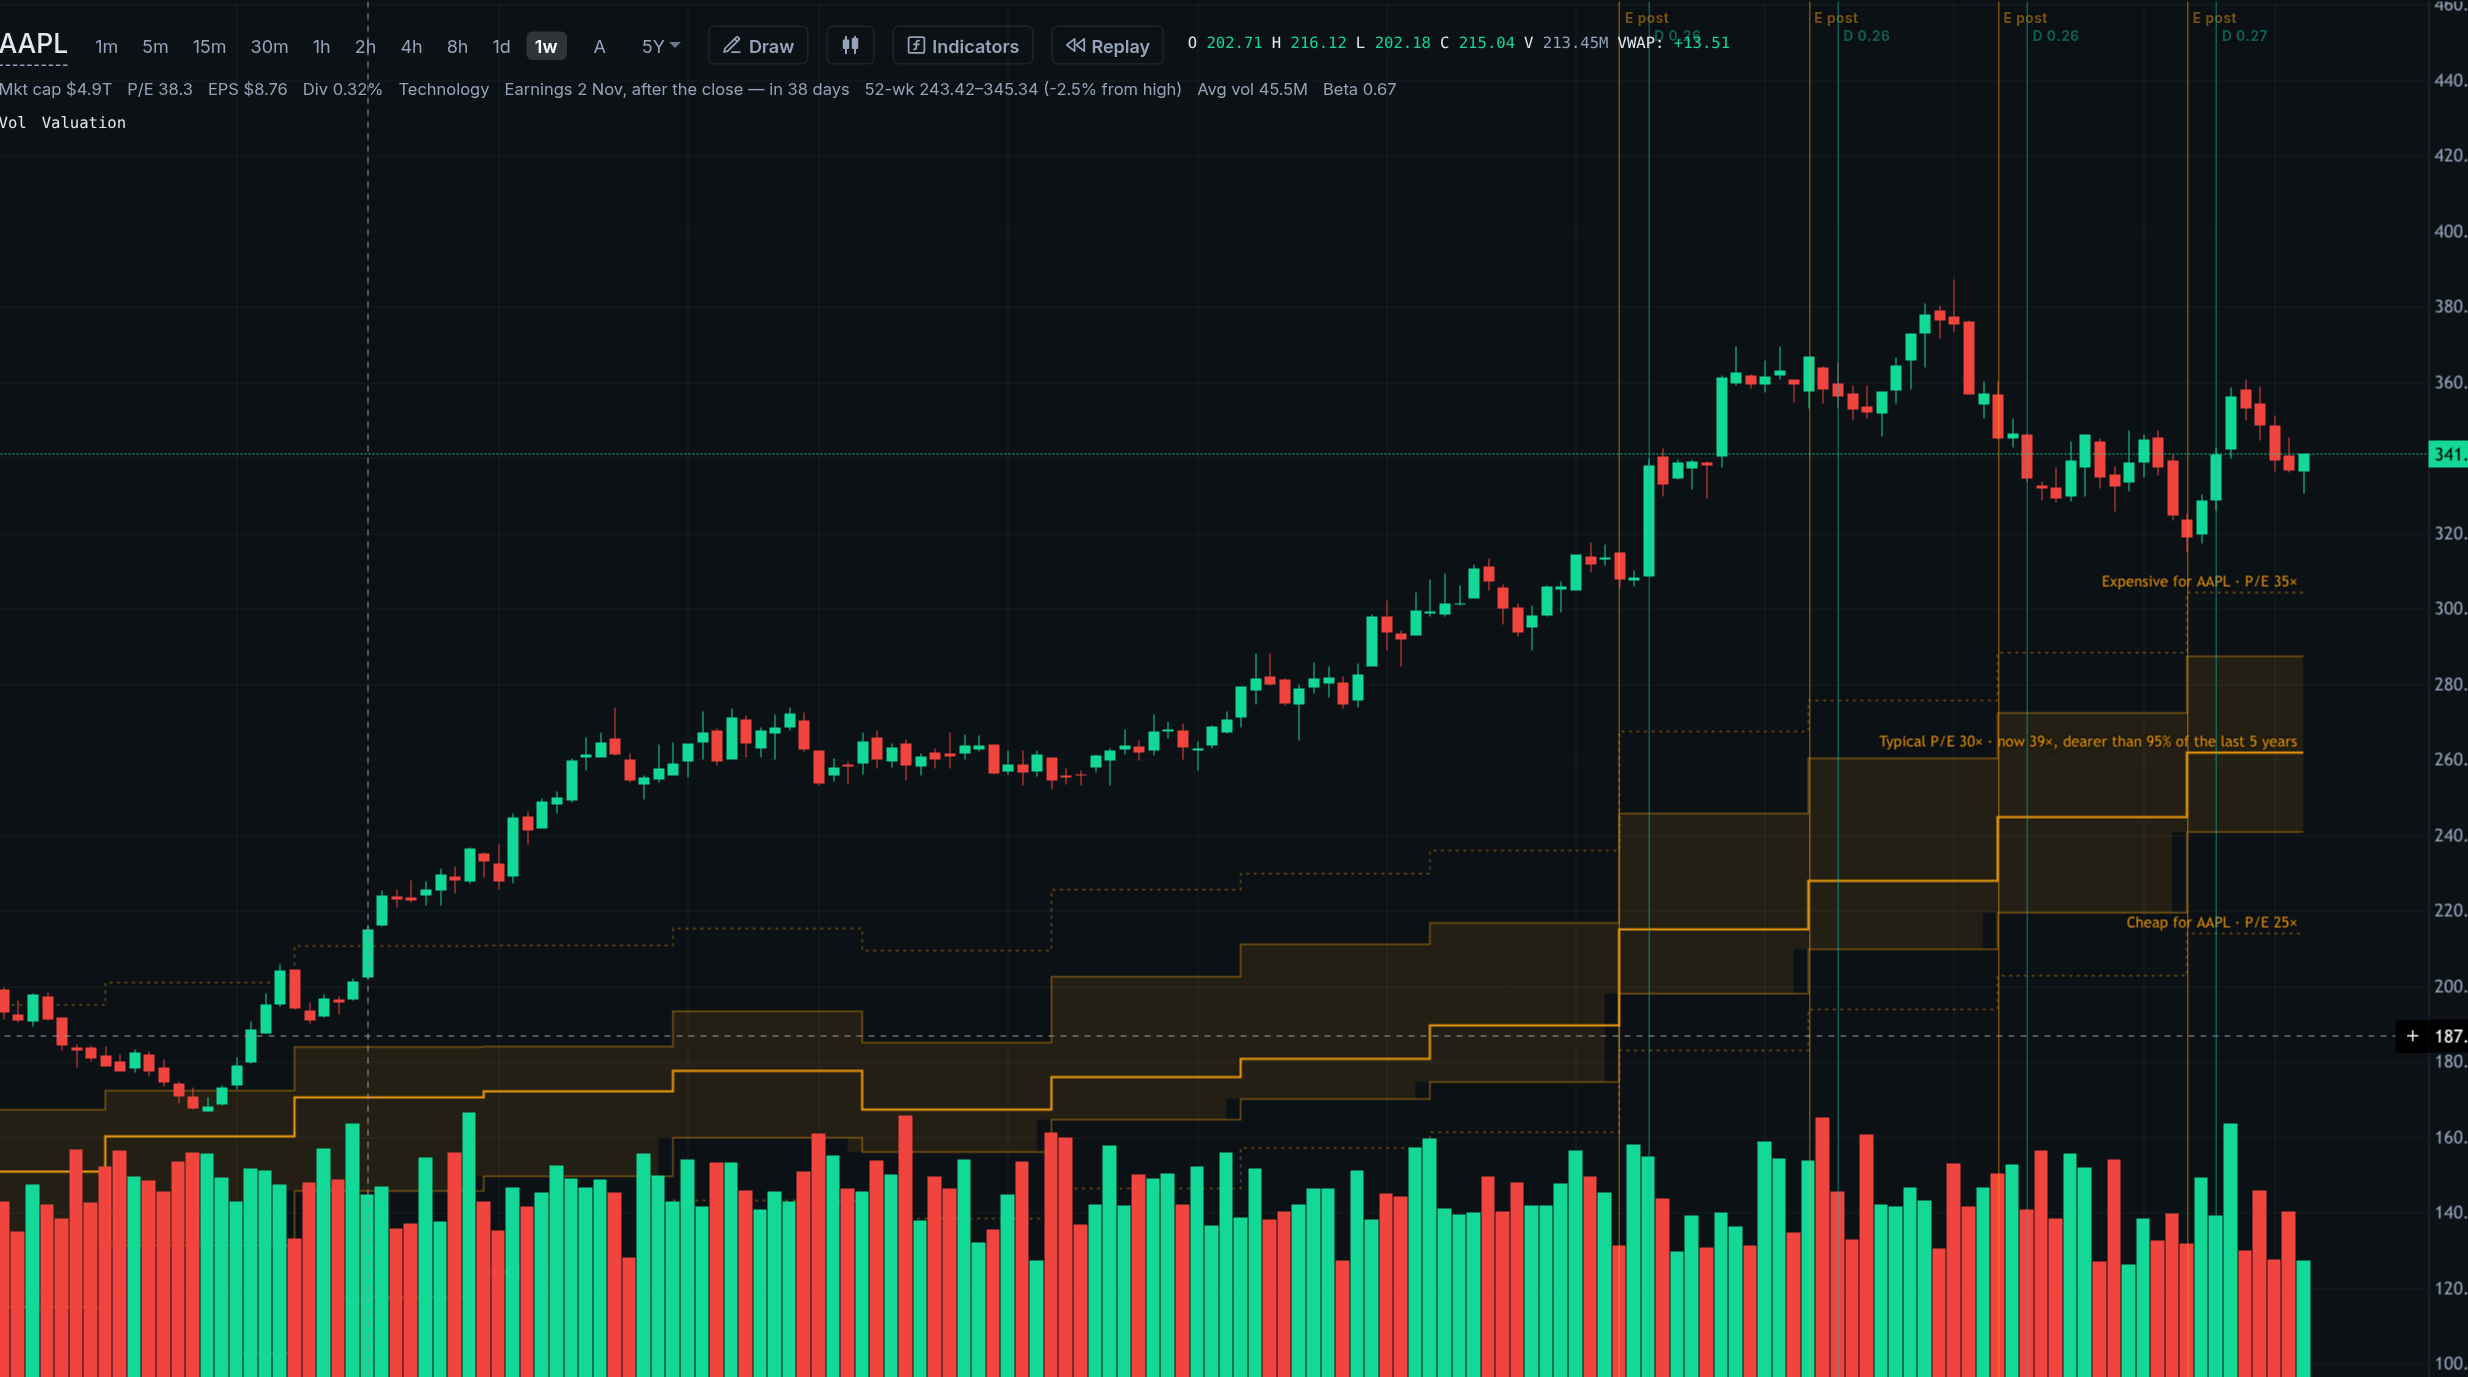
For US companies, reported figures from SEC filings show earnings, valuation history and insider transactions.
Other symbols and market readings
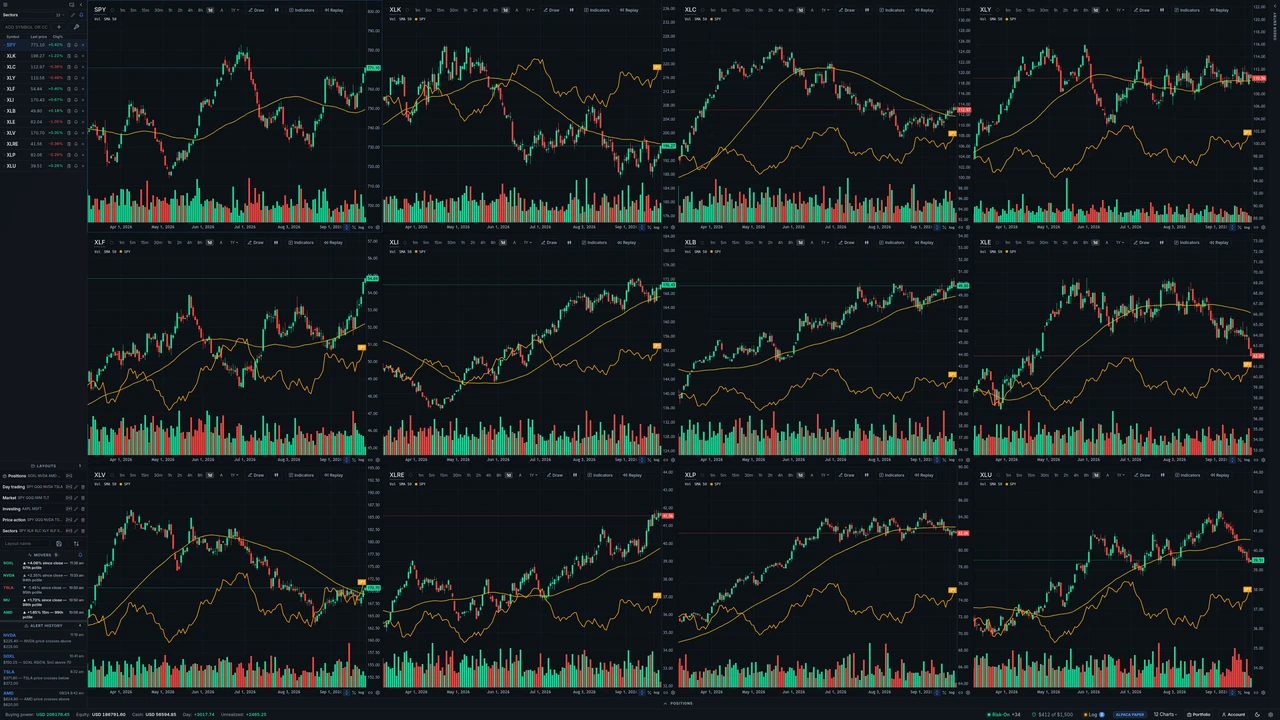
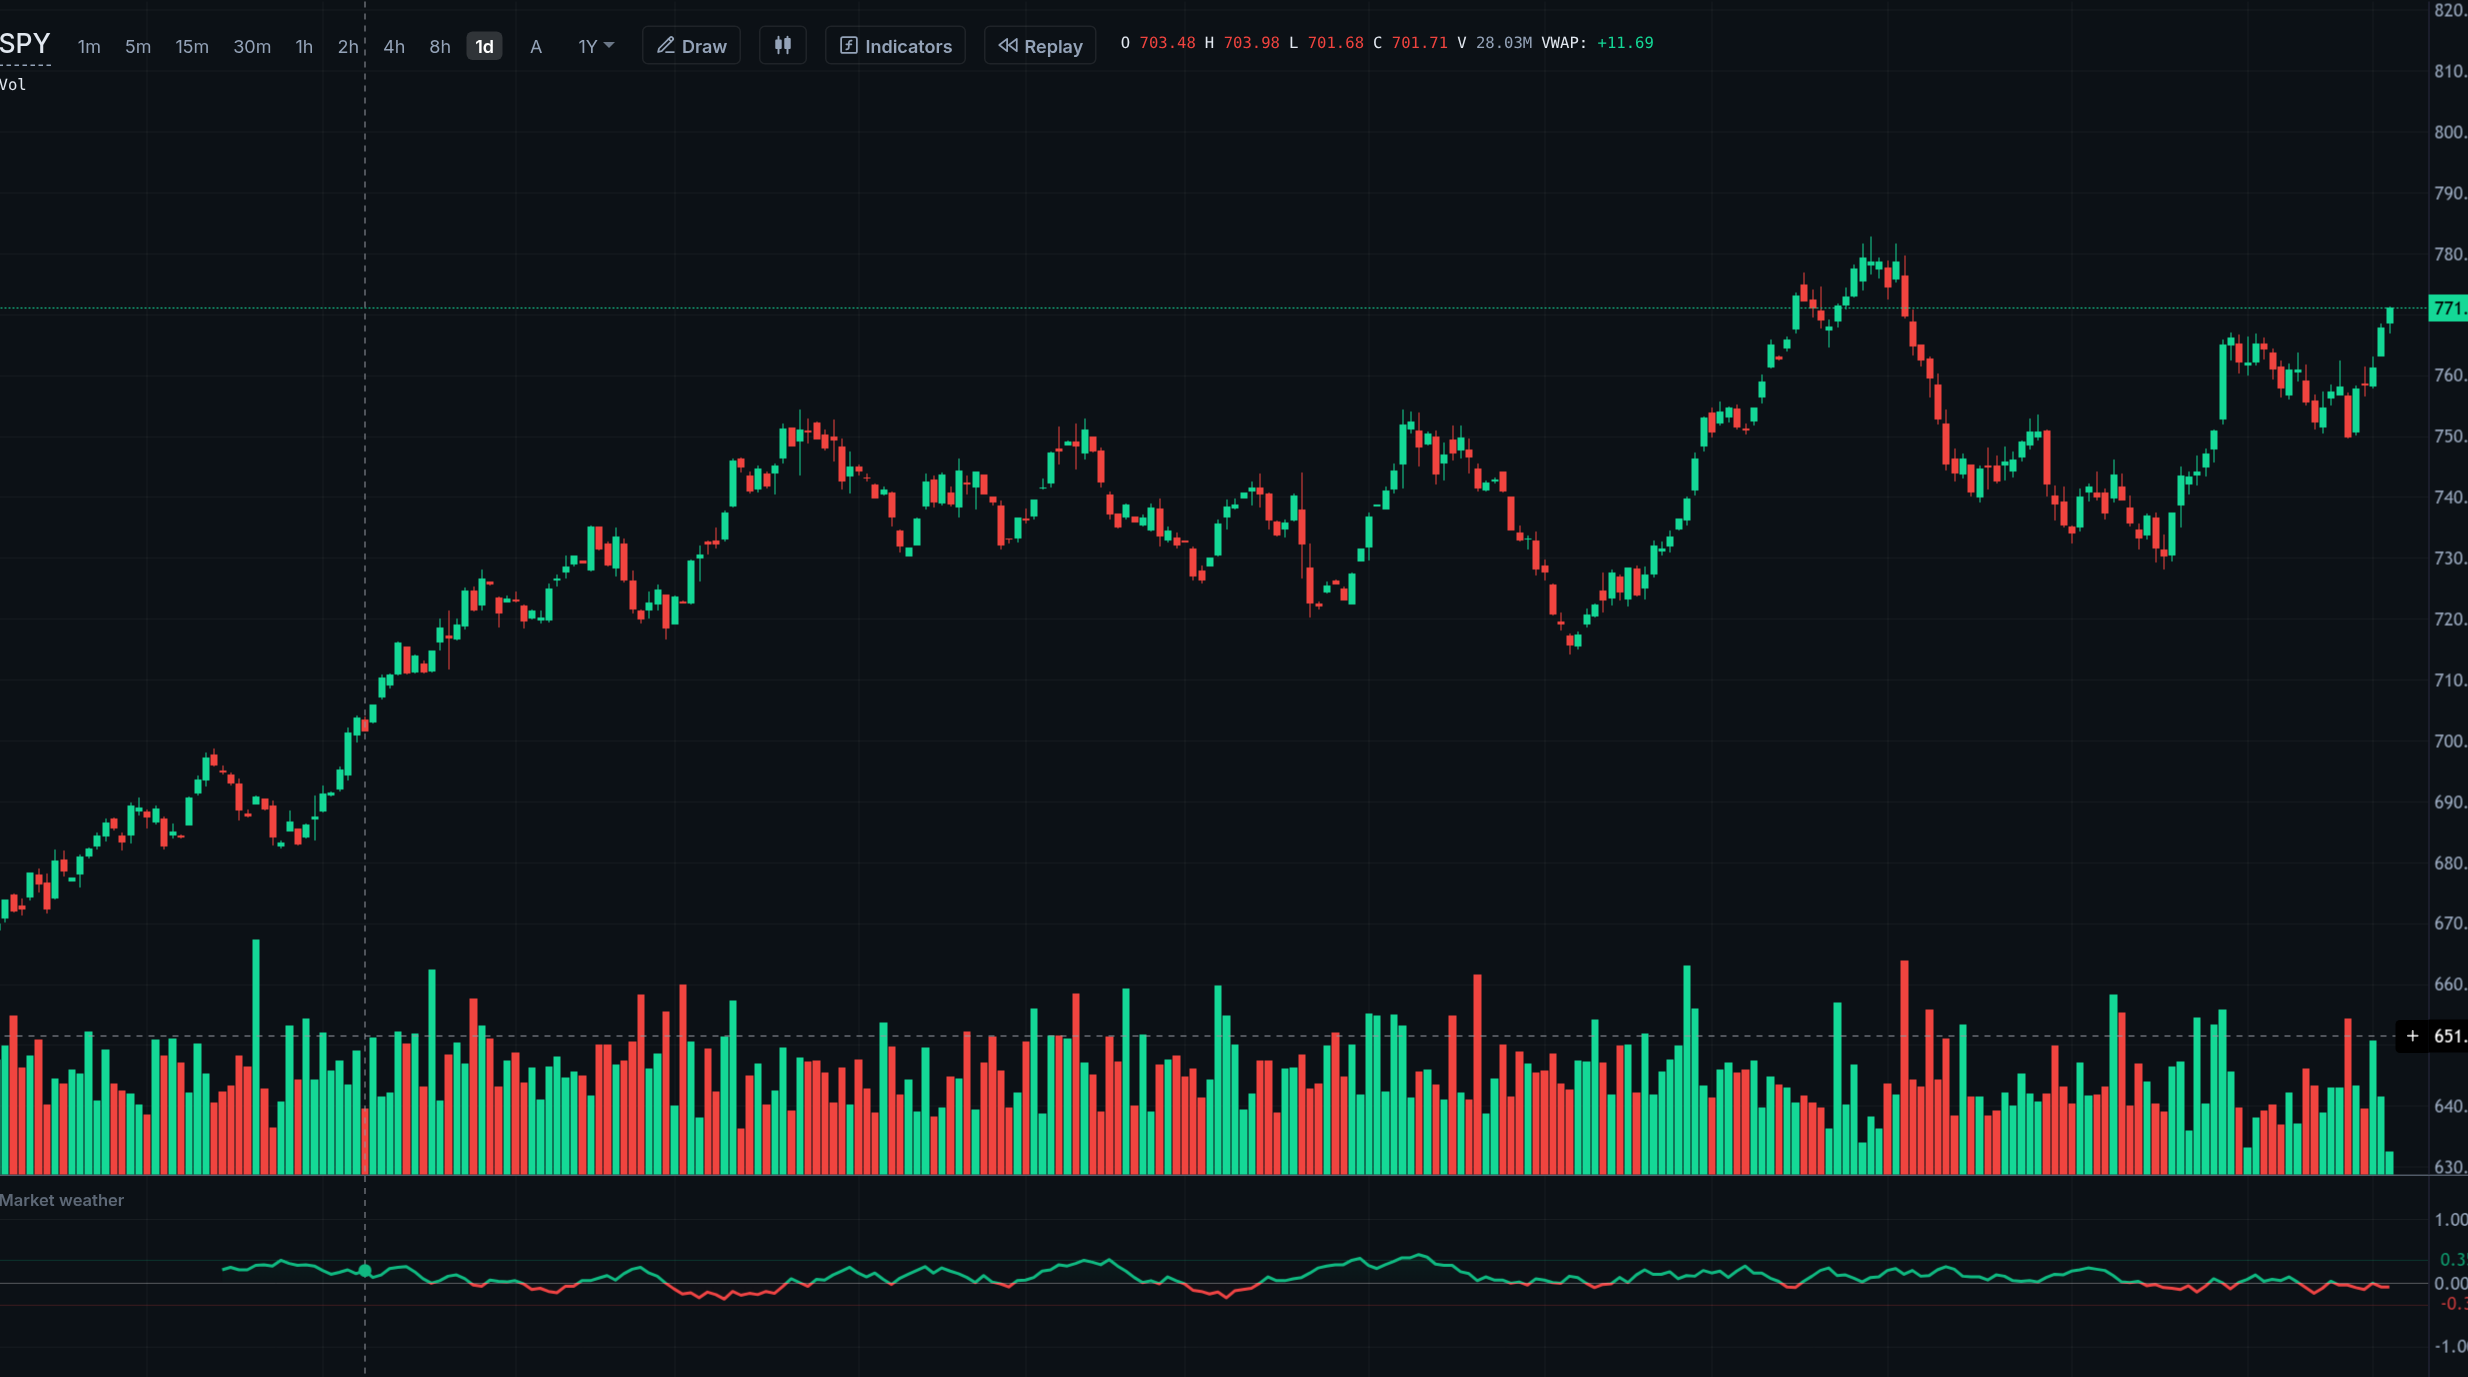
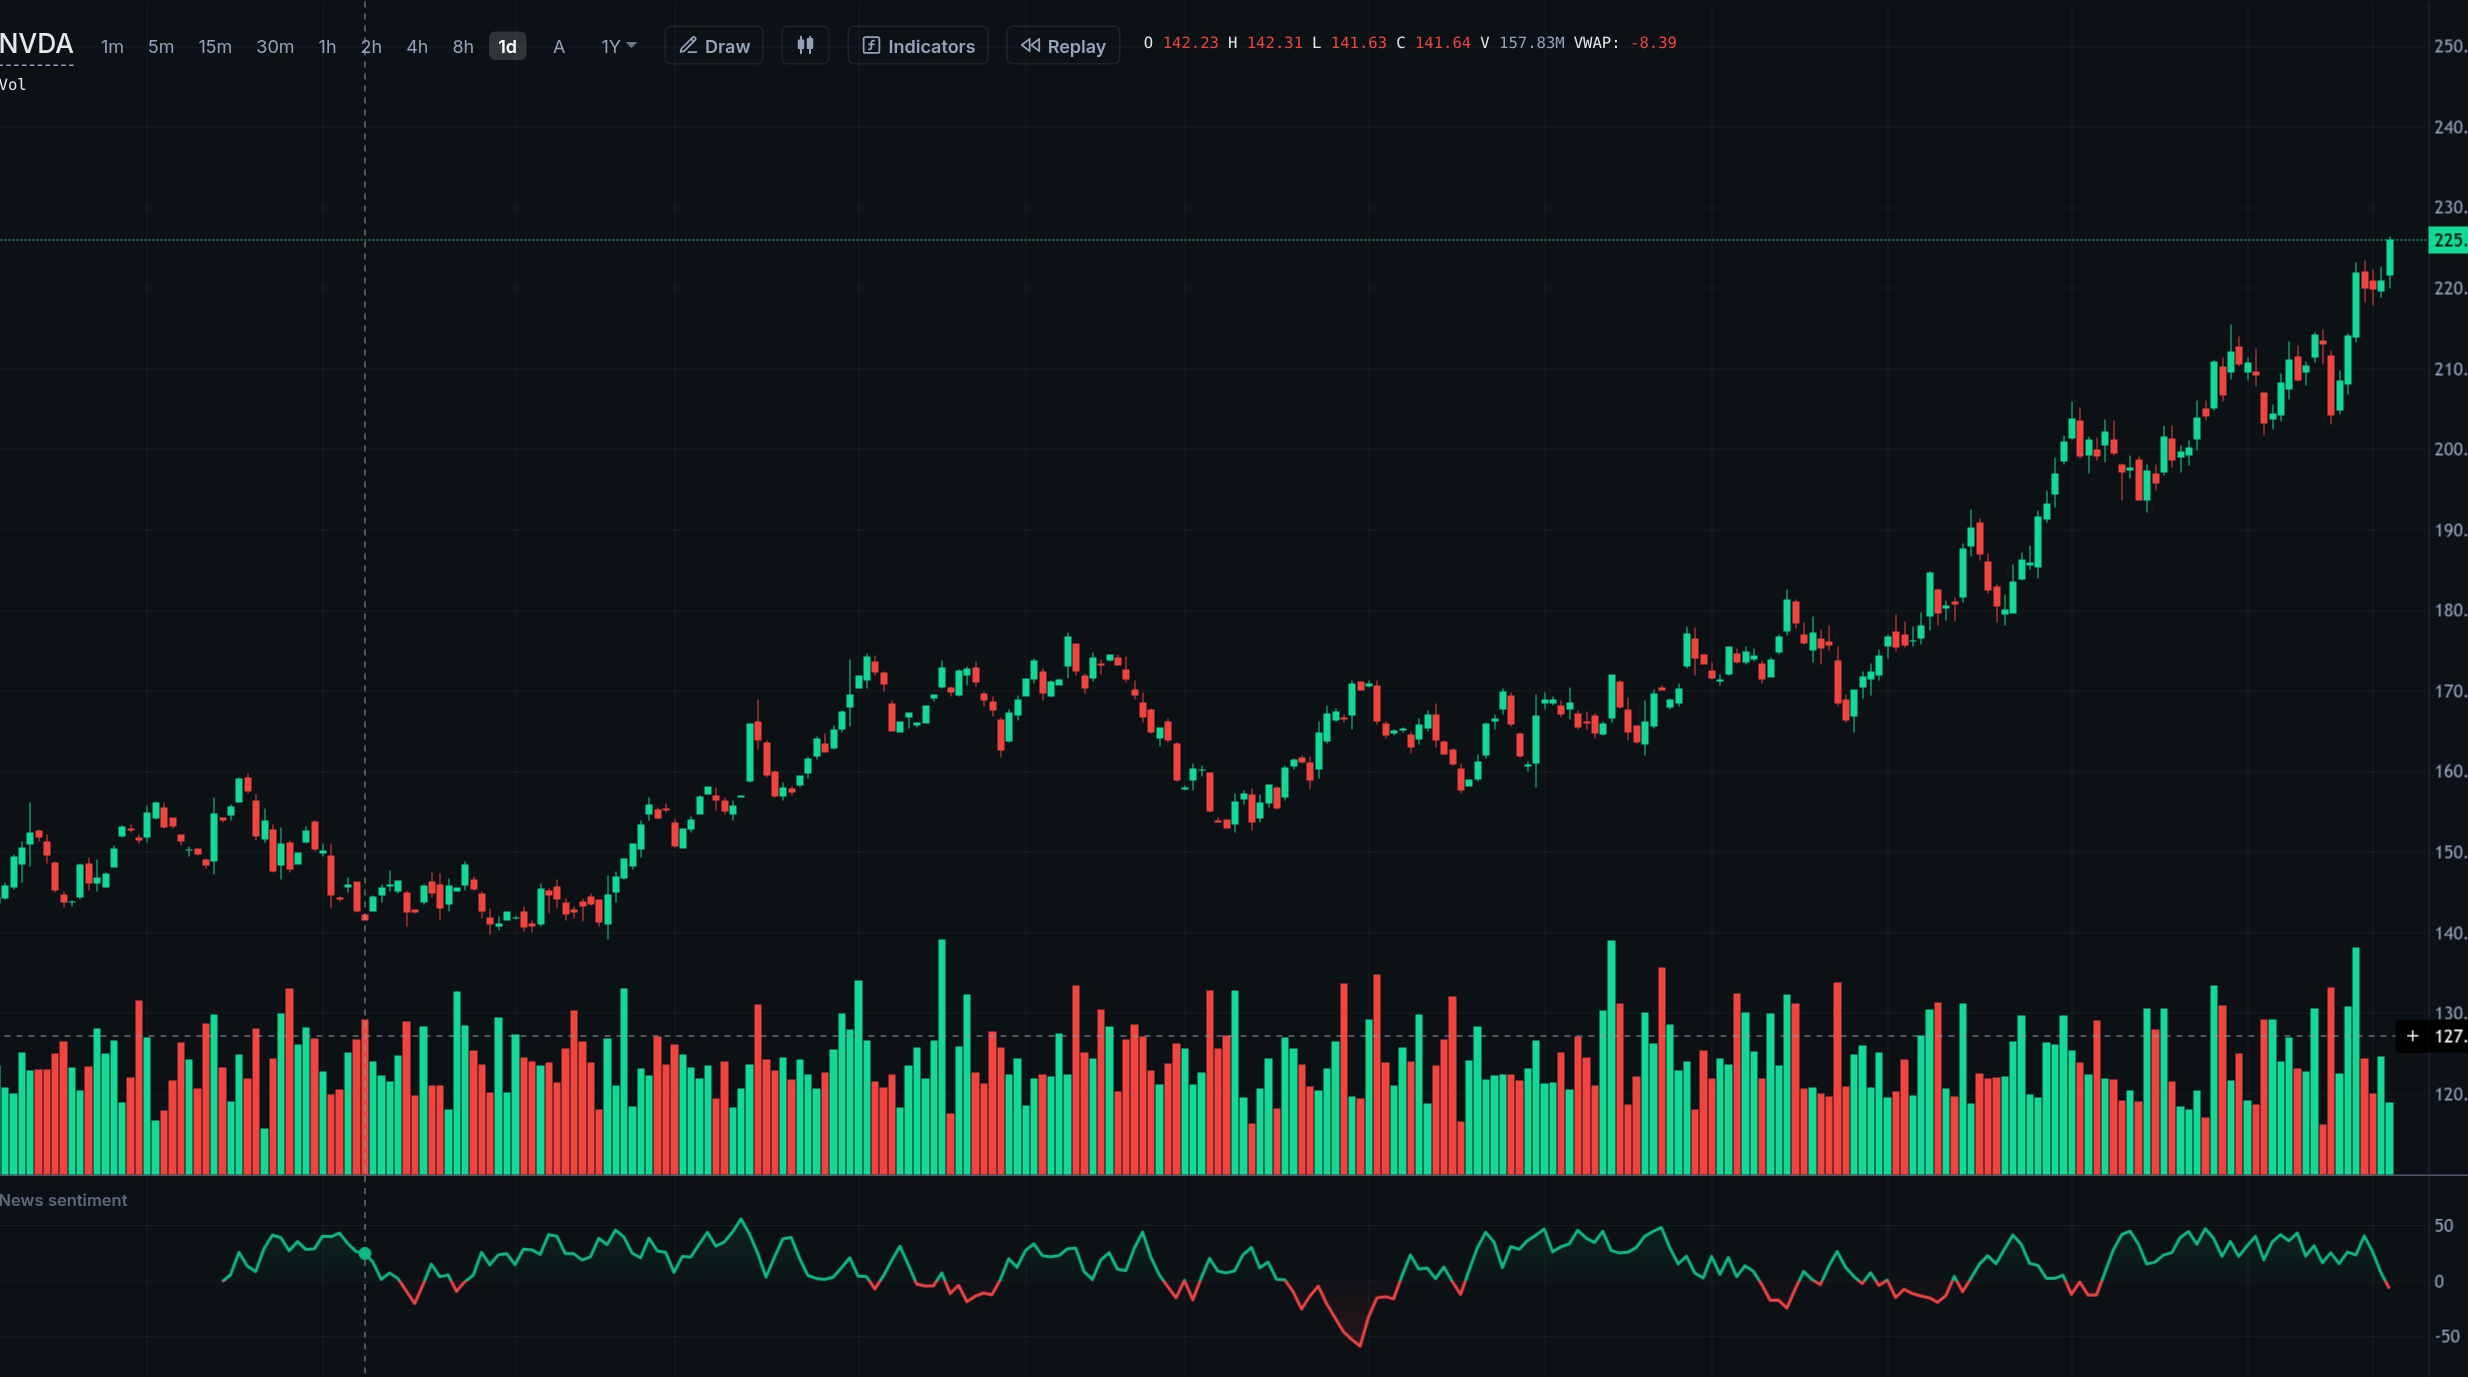
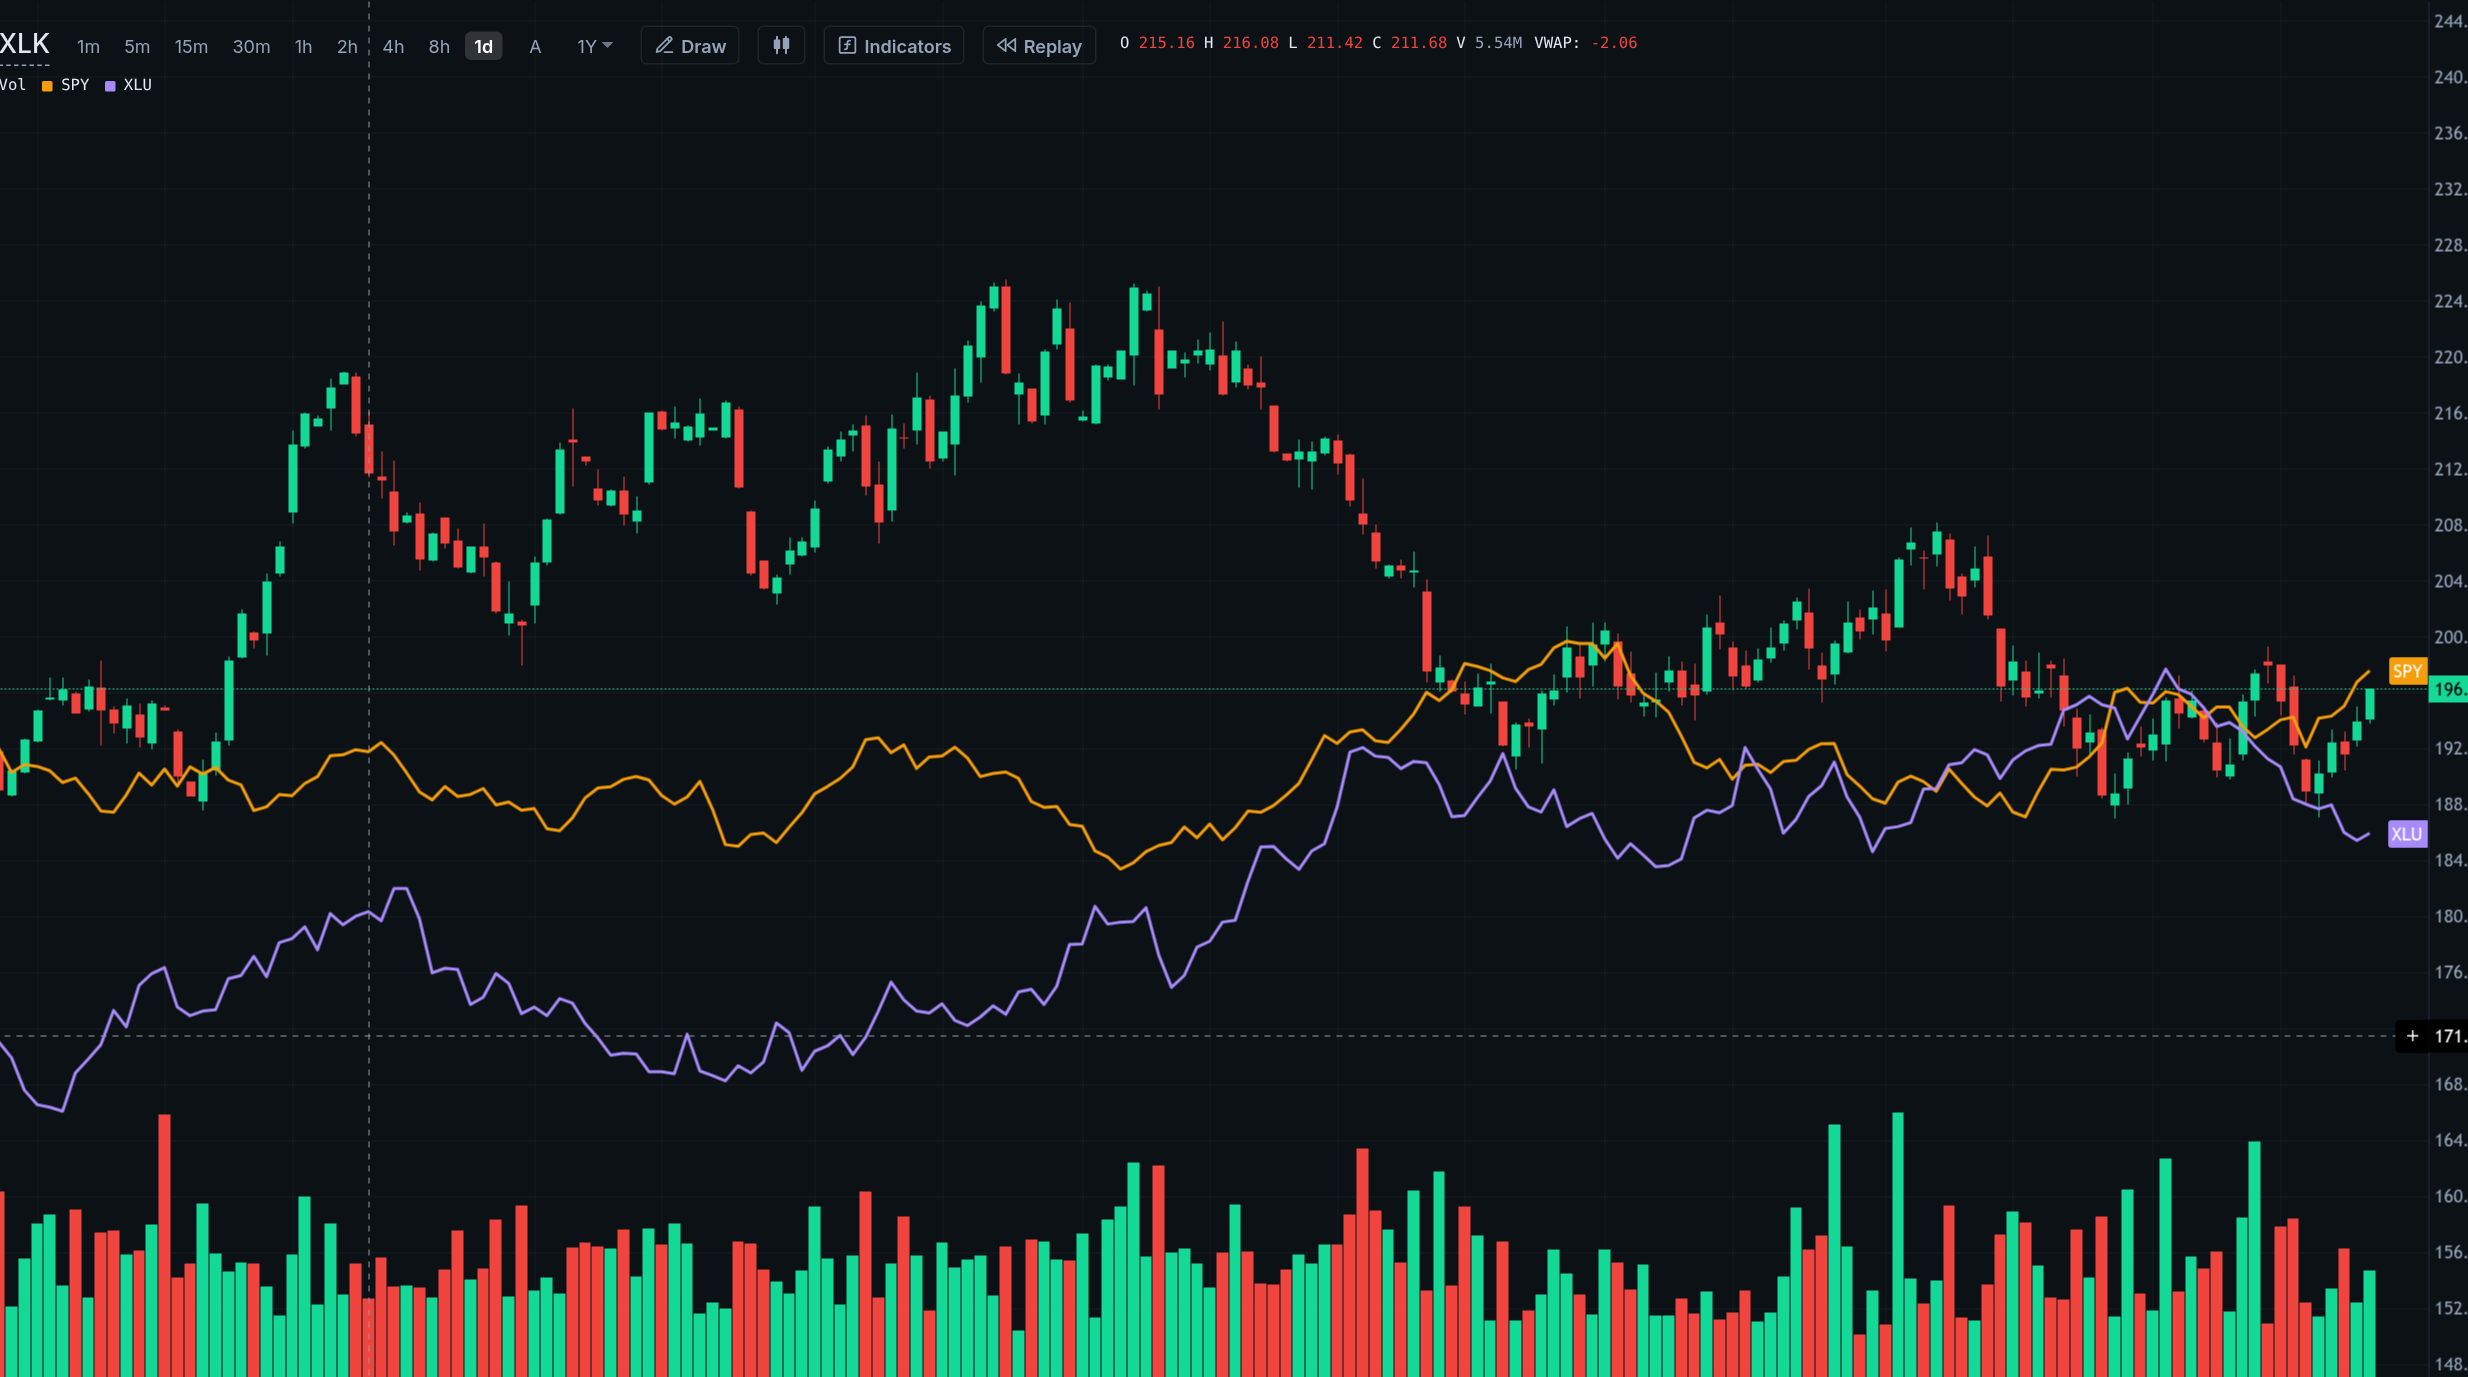
Compare other symbols on the same chart, see a market-risk reading and follow news sentiment.
Drawing tools and position planners
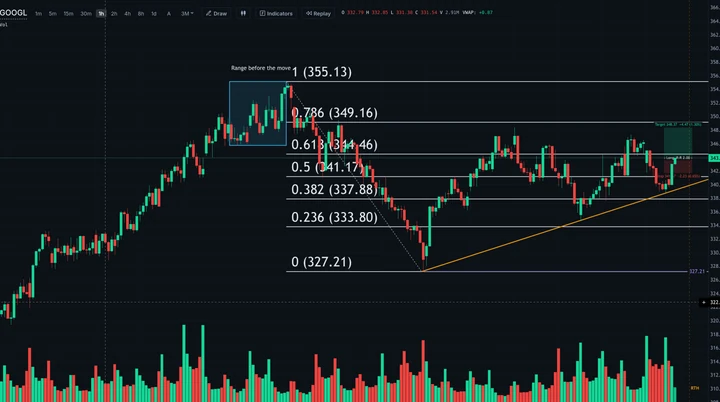
Draw trendlines, channels, Fibonacci and Gann tools, Elliott waves, XABCD patterns, shapes and notes. Measure a move or send a position plan to the order ticket. Drawings stay at the same price level at every candle size.
Explore the charts
Connect a market-data source to explore charts and indicators.