
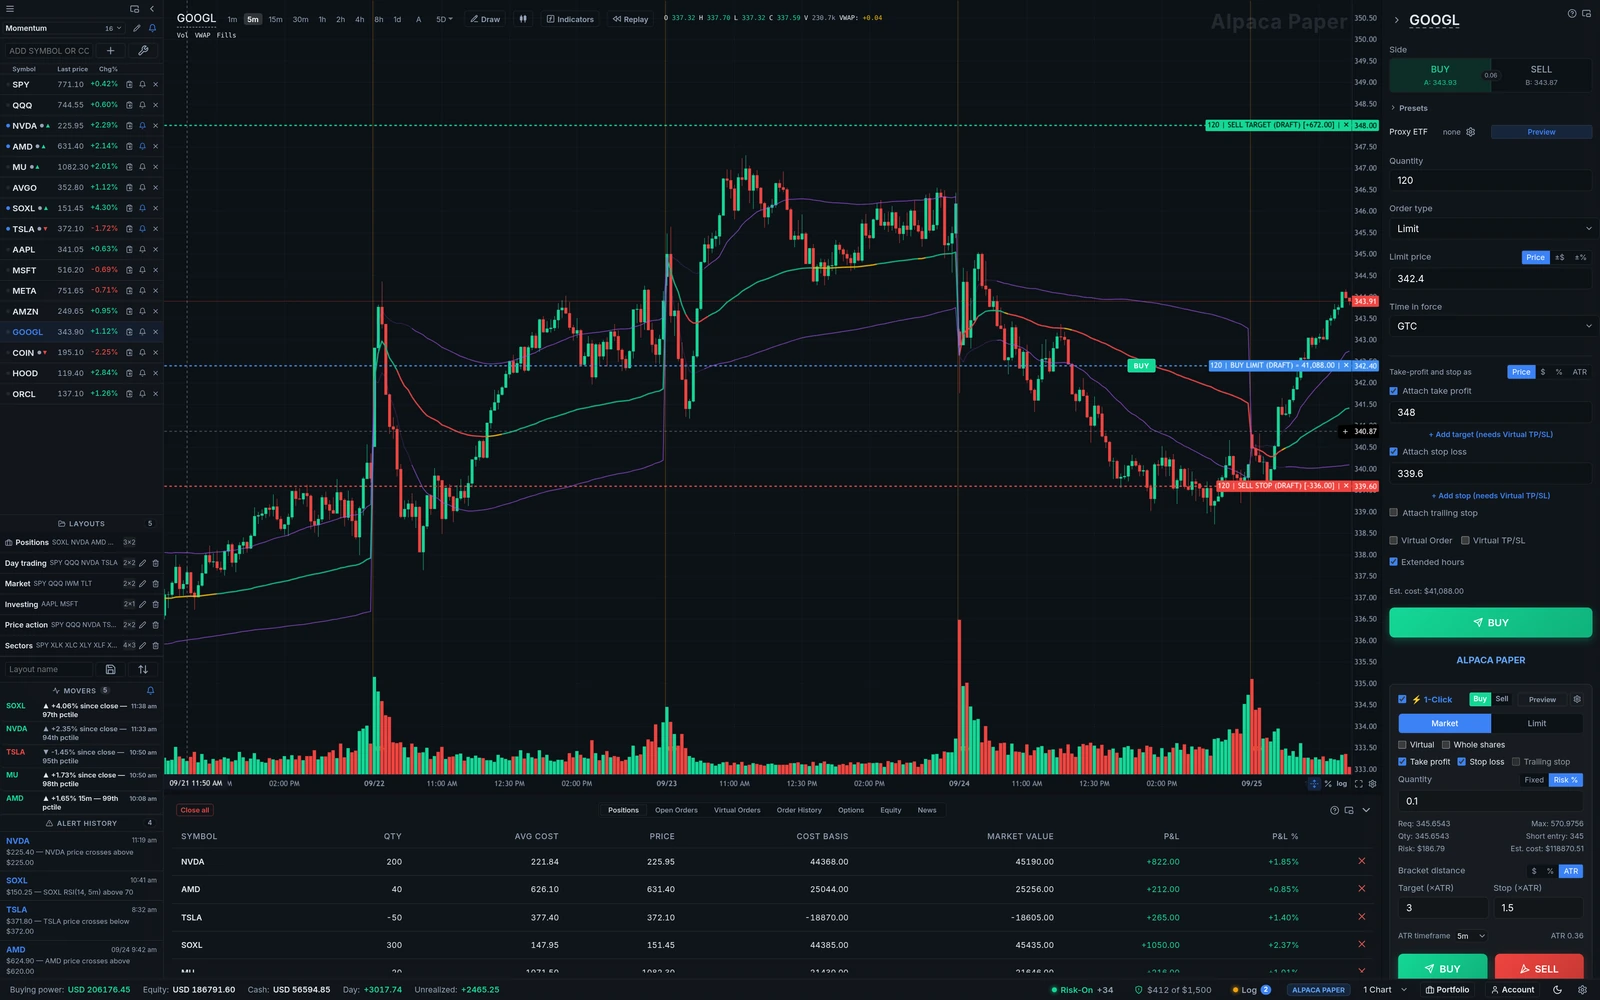
Entry, target and stop in one view
Set a limit, a target and a stop and they appear on the chart as lines, each with what it would make or lose at its price. Drag a line and the ticket’s price follows. Nothing is sent until you press the button.
Explore order entry, virtual orders, options, charts, accounts and the journal through screenshots. For layouts, themes and keyboard shortcuts, visit the Workspace page.
Use one order ticket for every connected broker. Virtual orders can provide order types that a broker’s API does not.
Set a limit, a target and a stop and they appear on the chart as lines, each with what it would make or lose at its price. Drag a line and the ticket’s price follows. Nothing is sent until you press the button.
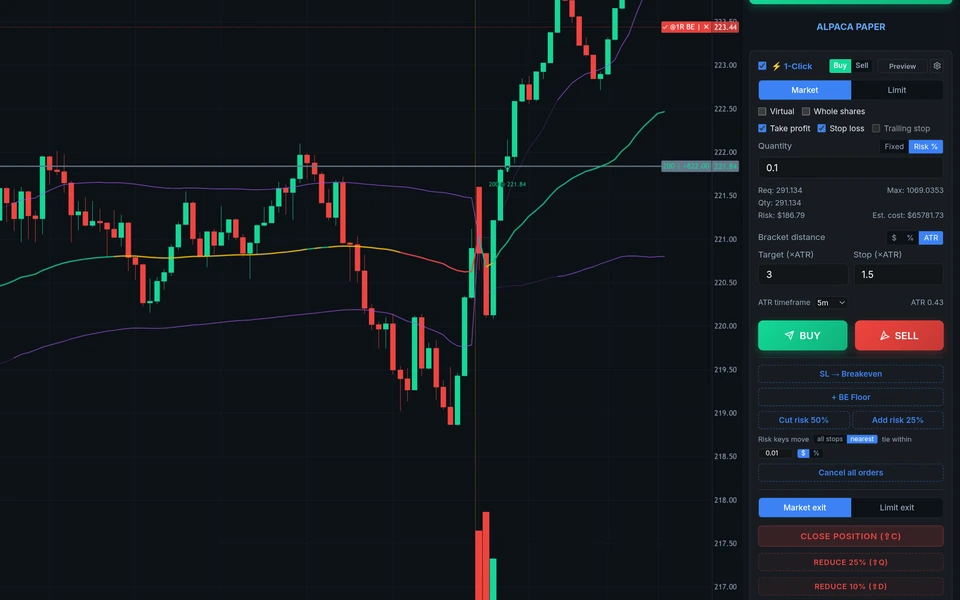
Choose the share of equity to risk and the bracket in $, % or ATR. One key places the order with a take-profit and stop, with no confirmation step. Other keys close, reduce or move every stop to breakeven.
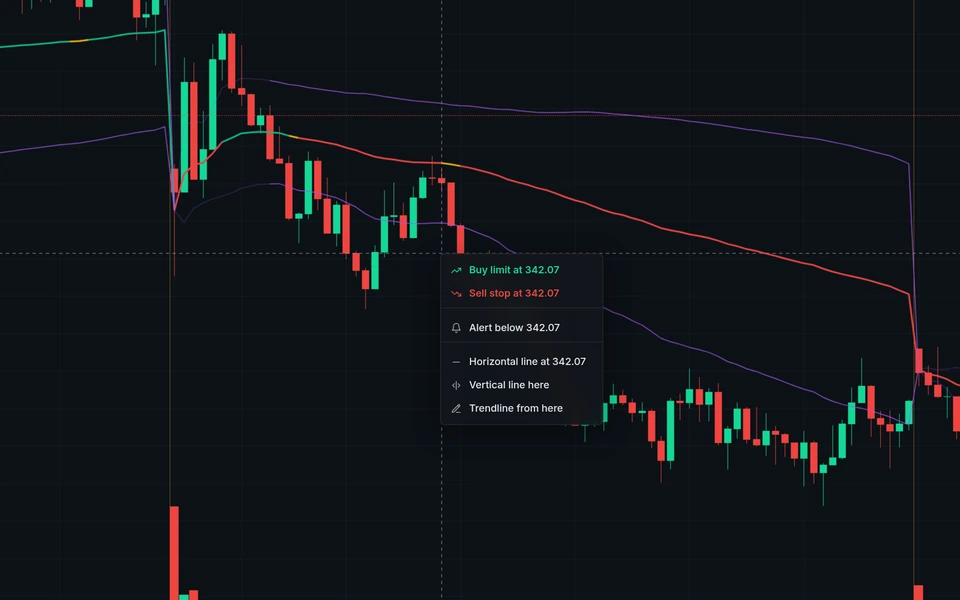
Right-click a level to buy or sell there, put a stop or target on the position, set an alert or draw a line. The ticket fills in. The order is sent only when placed.
TapeVision holds virtual stops and can send a closing order when the trigger price is reached, while the app runs on an awake computer, connected to the broker and receiving live prices for the session.
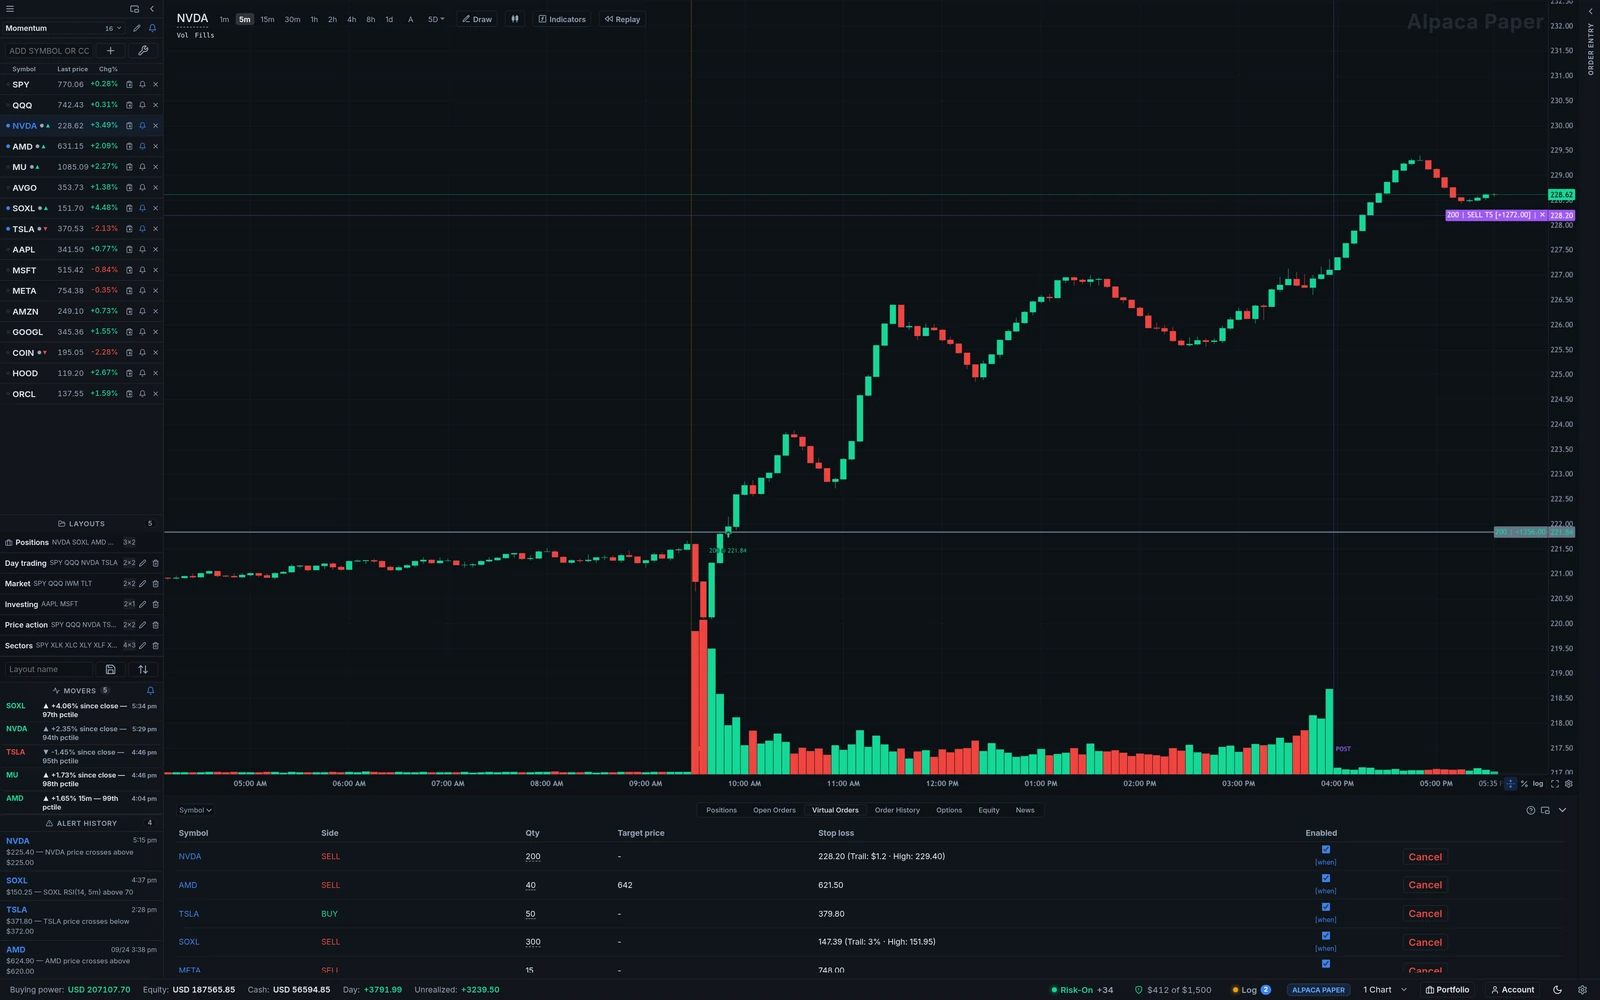
Use app-held stops, trailing stops and One Cancels Other orders in pre-market, after-hours and overnight, including where the broker accepts only limit orders.
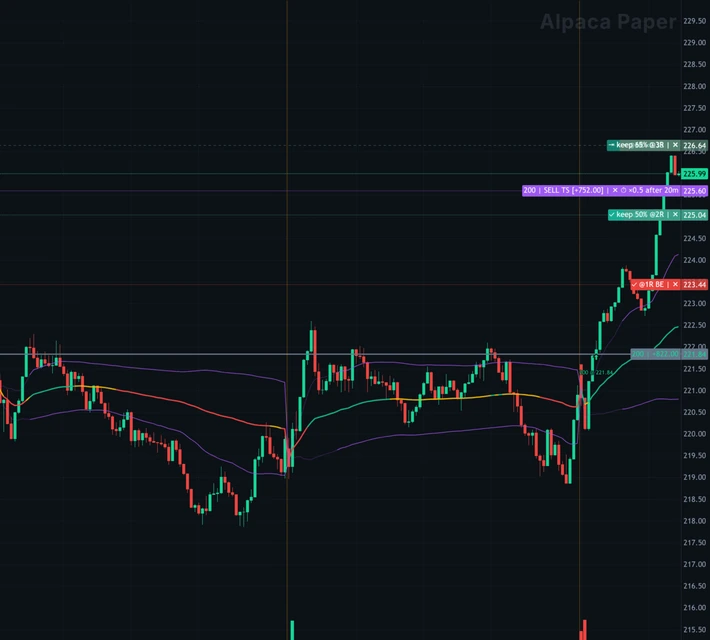
Set stages by R or distance from VWAP: move the stop to the entry price, set it to retain a chosen share of the price move if filled at that level, or tighten the trail after a period without a new high. A pullback never loosens it.
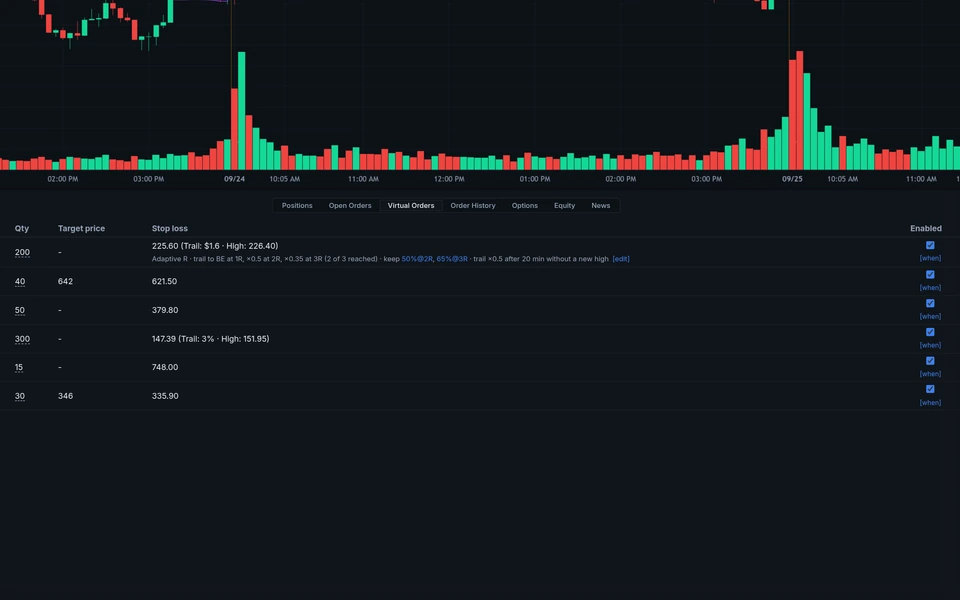
The table shows virtual orders with trailing stages and activation conditions. Orders are sized to the filled quantity and adjusted after a partial close.
Set limits for watched accounts. When a limit is reached, the kill switch refuses orders that would open or add to a position on that account. Orders that close or reduce a position remain allowed. A gap or a bad fill can still cost more.
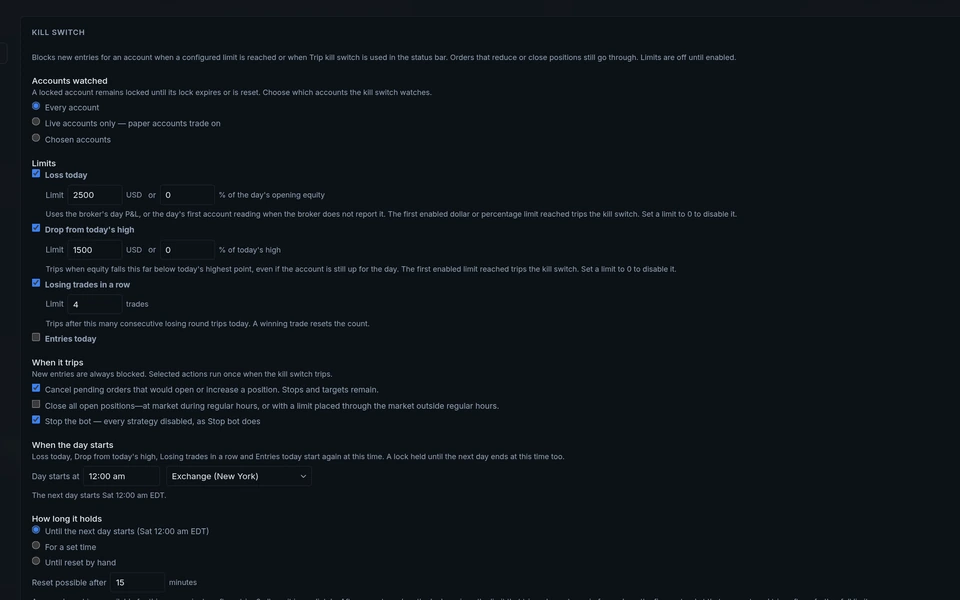
Choose which accounts to watch and set limits on today’s loss, a drop from today’s high, losing trades in a row or entries today. When a limit is reached, the kill switch can also cancel pending entry orders or close open positions. A lock lasts until the next day, for a set time or until it is reset by hand.
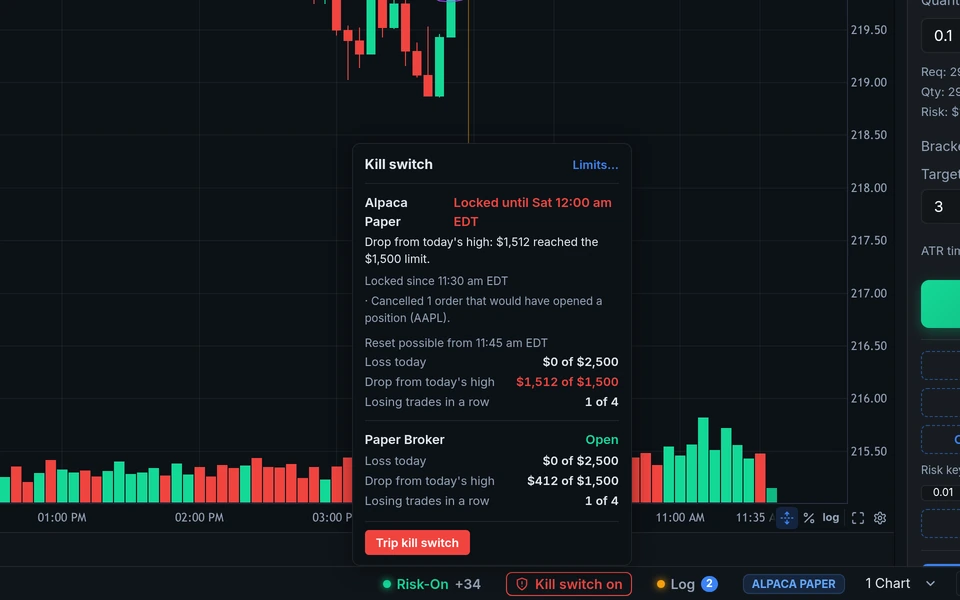
The status bar shows the lock. The panel lists each account, the rule that triggered the lock, when it started, what was cancelled and when a reset is possible. Use the panel to trip the kill switch by hand.
One builder sets both: conditions joined with ALL or ANY, and groups inside groups. The same conditions can also switch a virtual stop on or off.
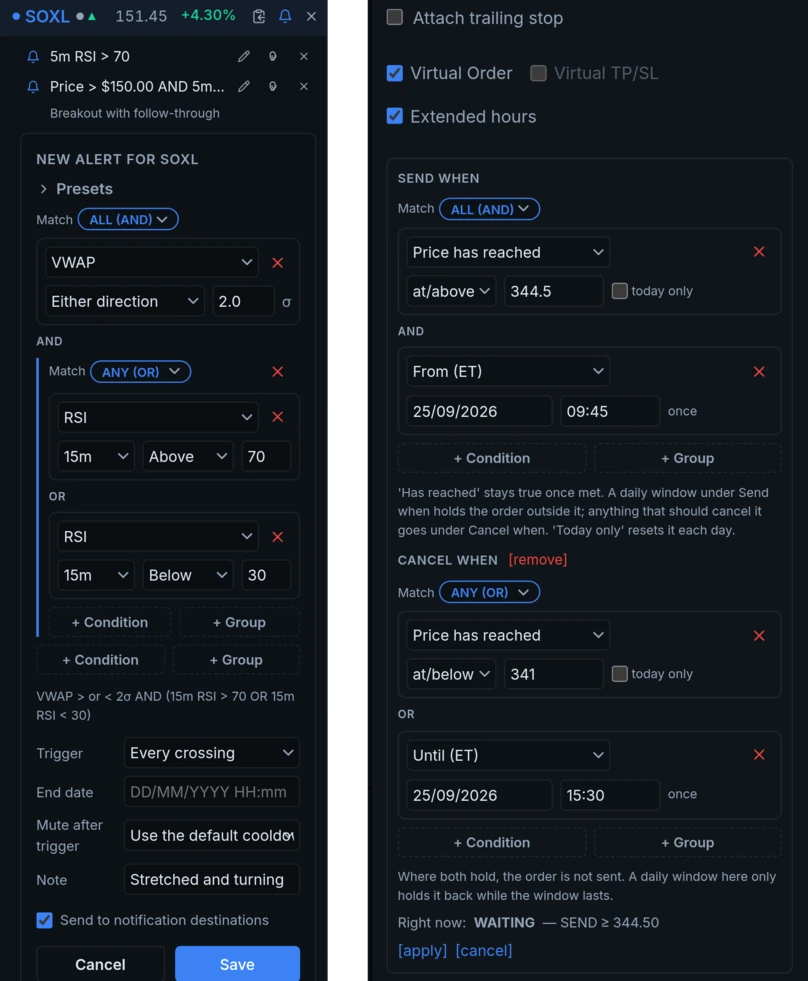
Alerts: price, RSI on any candle size, distance from VWAP, rate of change, CVD divergence and unusual moves. The one on the left fires when SOXL is two deviations from VWAP and the 15-minute RSI is above 70 or below 30. The message names the condition that fired, and can go to a phone or a chat.
Orders: a market or limit order is held until its Send when conditions are met, then is sent as if placed at that moment; Cancel when cancels the order before it is sent. The one on the right buys 100 GOOGL at 344.20 once the price is at 344.50 or above after 09:45 New York time, and is called off below 341 or at 15:30. It is watched while TapeVision is running.
Connect Alpaca, Trading 212, Interactive Brokers or Webull Australia accounts, or use the built-in paper broker without a broker account.
| Broker | TapeVision orders | The broker's API, outside regular hours |
|---|---|---|
| Alpaca | Stops, trailing stops, One Cancels Other and brackets held by the app | Limit orders only. A trailing stop does not trigger outside regular hours, and a bracket needs them. |
| Trading 212 | Stops, trailing stops and One Cancels Other held by the app, using prices from Alpaca, Interactive Brokers or Webull | Market orders only. No trailing stop and no One Cancels Other in the API, and no prices. |
| Webull Australia | Stops and trailing stops held by the app | Limit orders only. |
| Interactive Brokers | Stops, trailing stops, One Cancels Other and attached exits held by the app | Stop-limit orders can be set to work outside regular hours; plain stop orders cannot. |
Broker order support can change. Orders supported by the broker can also be sent directly to the broker.
View option chains and Greeks, place single- and multi-leg orders, compare payoff diagrams, show a strategy’s payoff on the chart and roll positions. Options trade in regular hours.
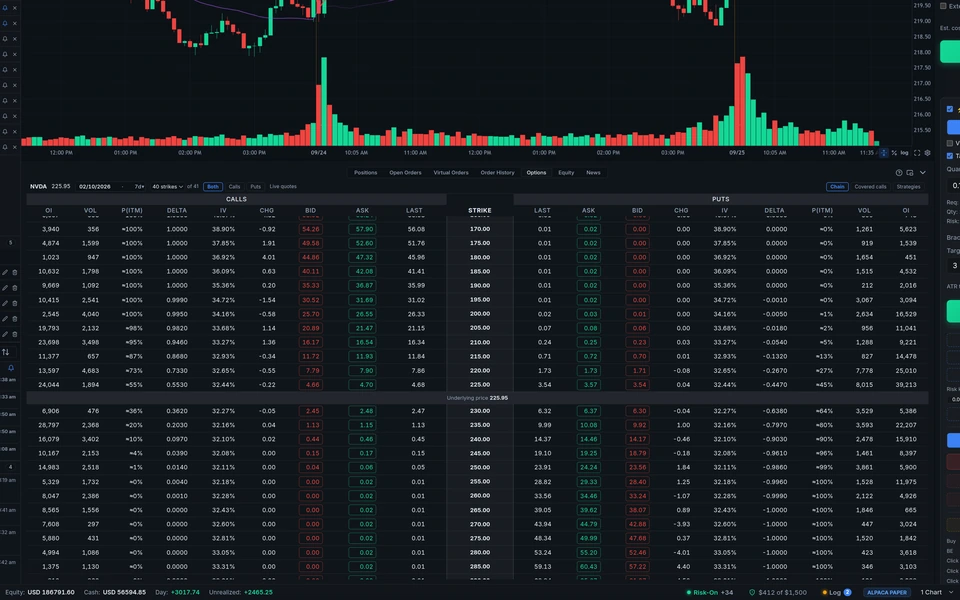
Compare calls and puts with open interest, volume, delta, implied volatility and probability of finishing in the money. Select a bid or ask to open an order ticket, or add contracts to one multi-leg order.
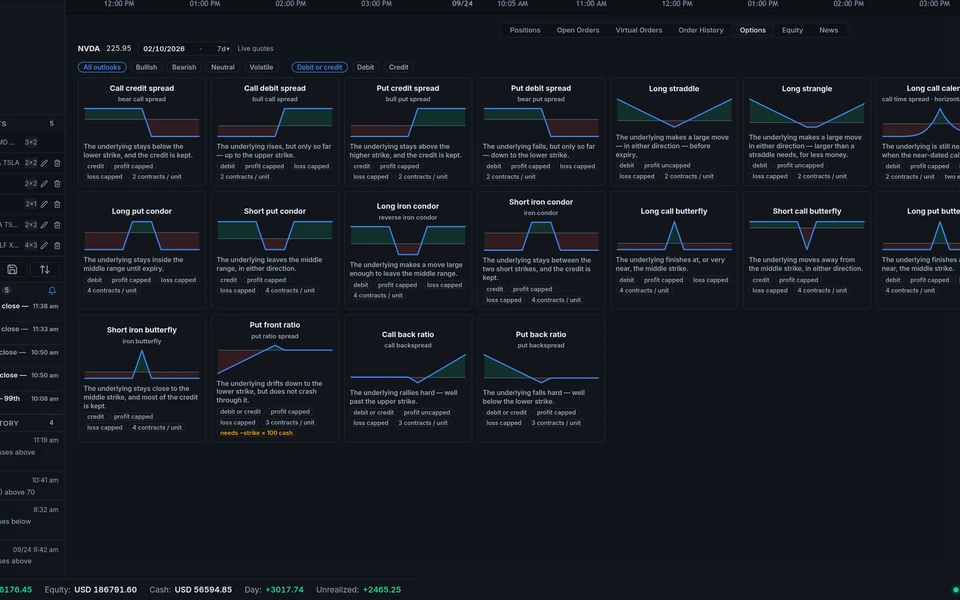
Choose a market outlook to compare structures and their payoff on the live chain. The ticket shows maximum profit and loss, breakevens and estimated margin before sending one order.
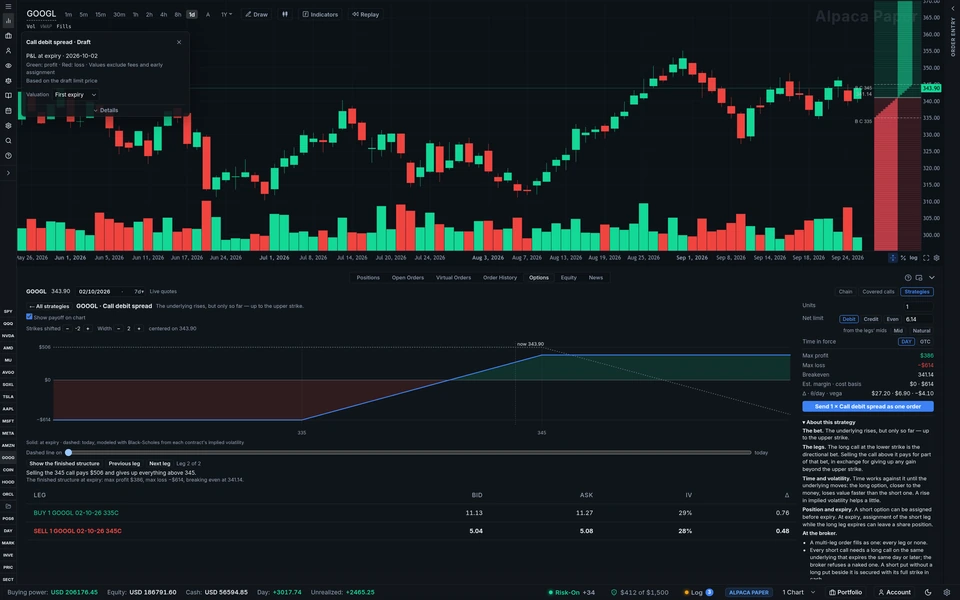
Build a strategy one leg at a time, with an explanation of each leg. The payoff, maximum profit, maximum loss and breakevens update as legs are added. Move the strikes or change the width, then send every leg as one order.
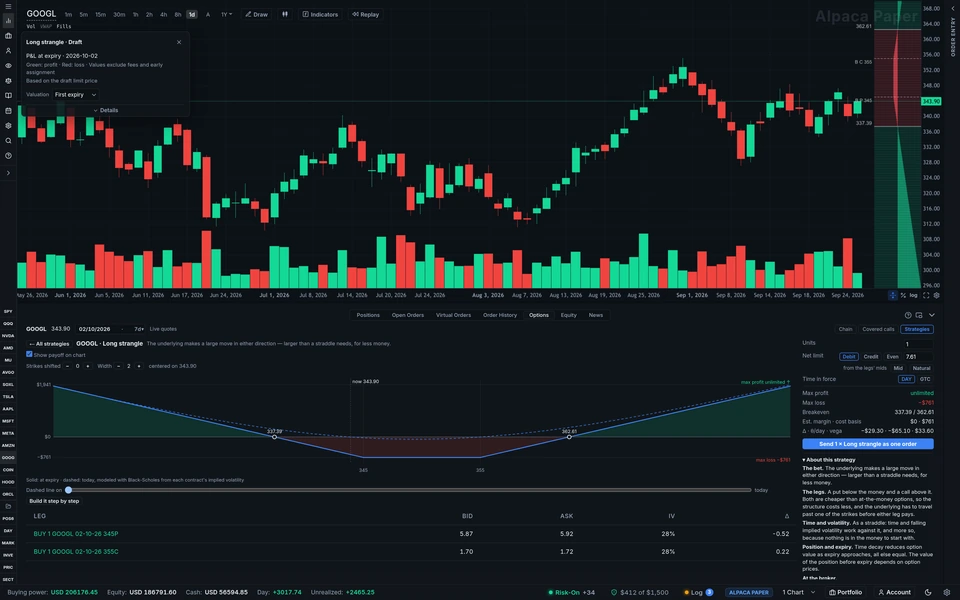
Show a strategy’s payoff on the underlying chart: green where the strategy would make money and red where it would lose money, with strikes and breakevens marked. The overlay follows a strategy builder draft or an open grouped position and can be valued at expiry or on a chosen date. Values exclude fees and early assignment.
Charts adapt as you zoom, with indicators from VWAP to company figures and drawing tools. See chart types and indicators on the Charts page.
Turn on automatic intervals and candle sizes change as you zoom. Zoom into a past session to request smaller candles, subject to the data source’s coverage and availability.
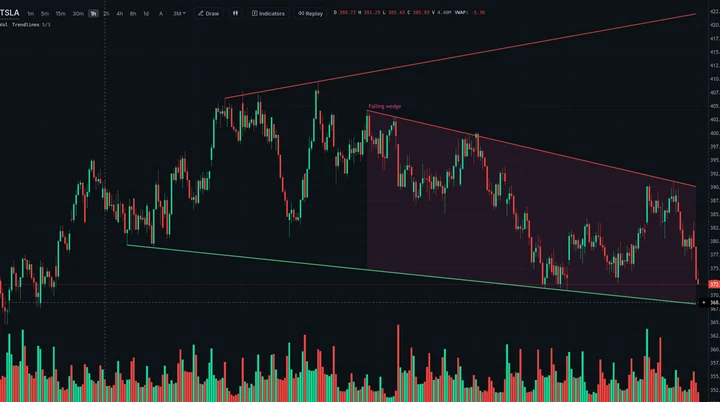
Automatic support and resistance zones, market-structure marks, trendlines, channels, wedges, consolidation ranges and volume levels. Each mark uses completed candles.
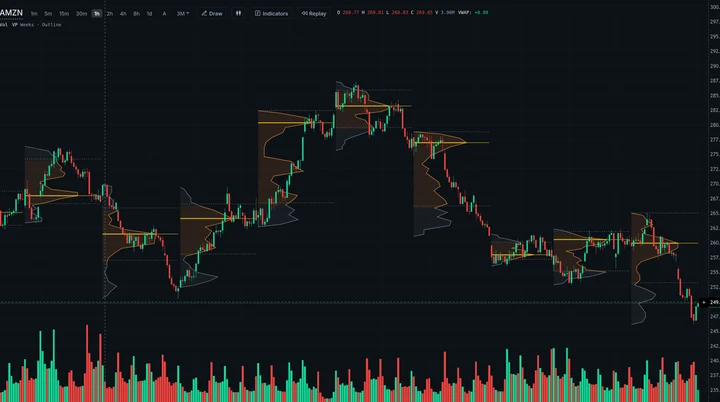
Show volume profiles for the visible range, a day, session, week, month or regular hours only. Choose filled or outline profiles with value-area lines.
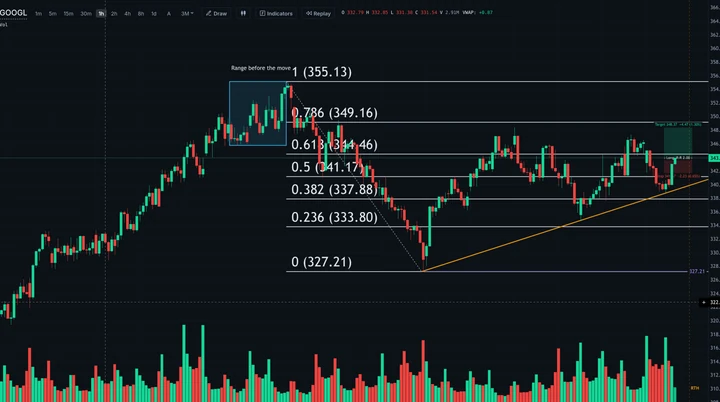
Draw trendlines, channels, Fibonacci and Gann tools, Elliott waves, XABCD patterns, shapes and notes. Measure a move or send a position plan to the order ticket.
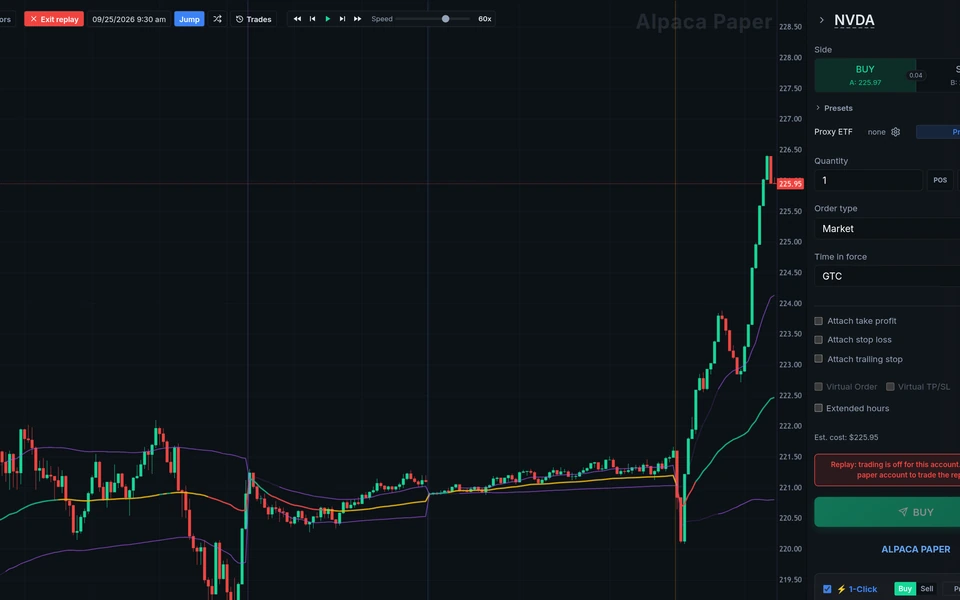
Replay available historical data and paper trade while real accounts stay locked. One-second detail depends on data coverage.
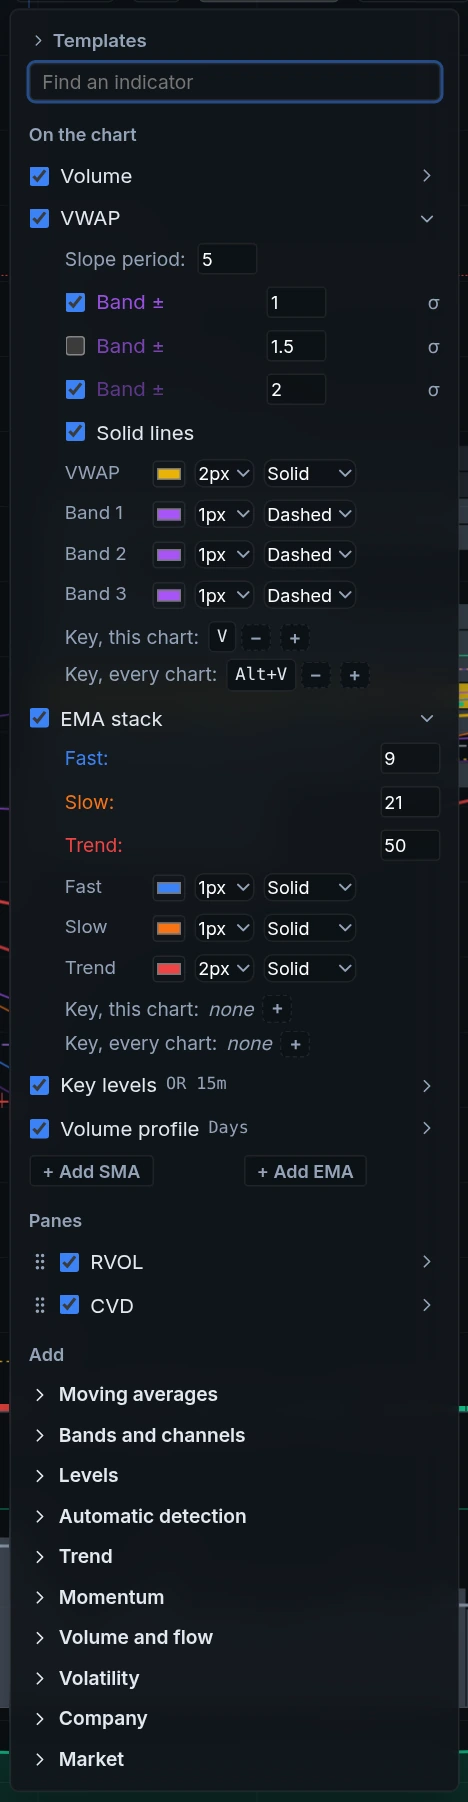
VWAP and its bands, moving averages, channels, Ichimoku, Supertrend, RSI, MACD, CVD with divergences and more. Each line’s color, width and dash can be set.
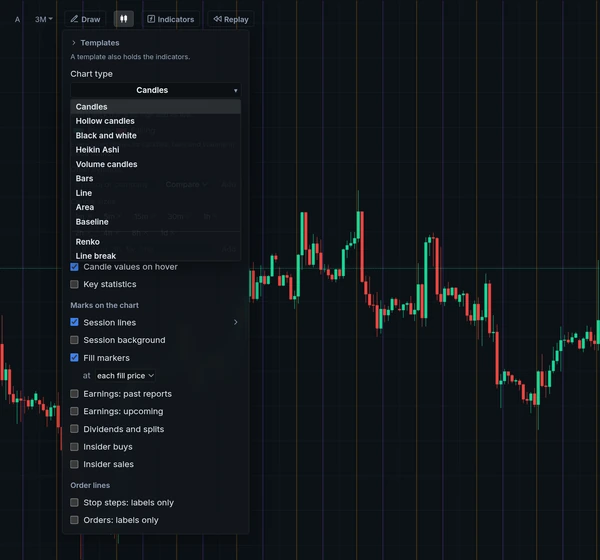
Candles, hollow candles, Heikin Ashi, volume candles, Renko, line break, Kagi, point and figure and more, chosen chart by chart.
View accounts, virtual sub-accounts, portfolio results, statistics and the automatic trade journal separately or together.
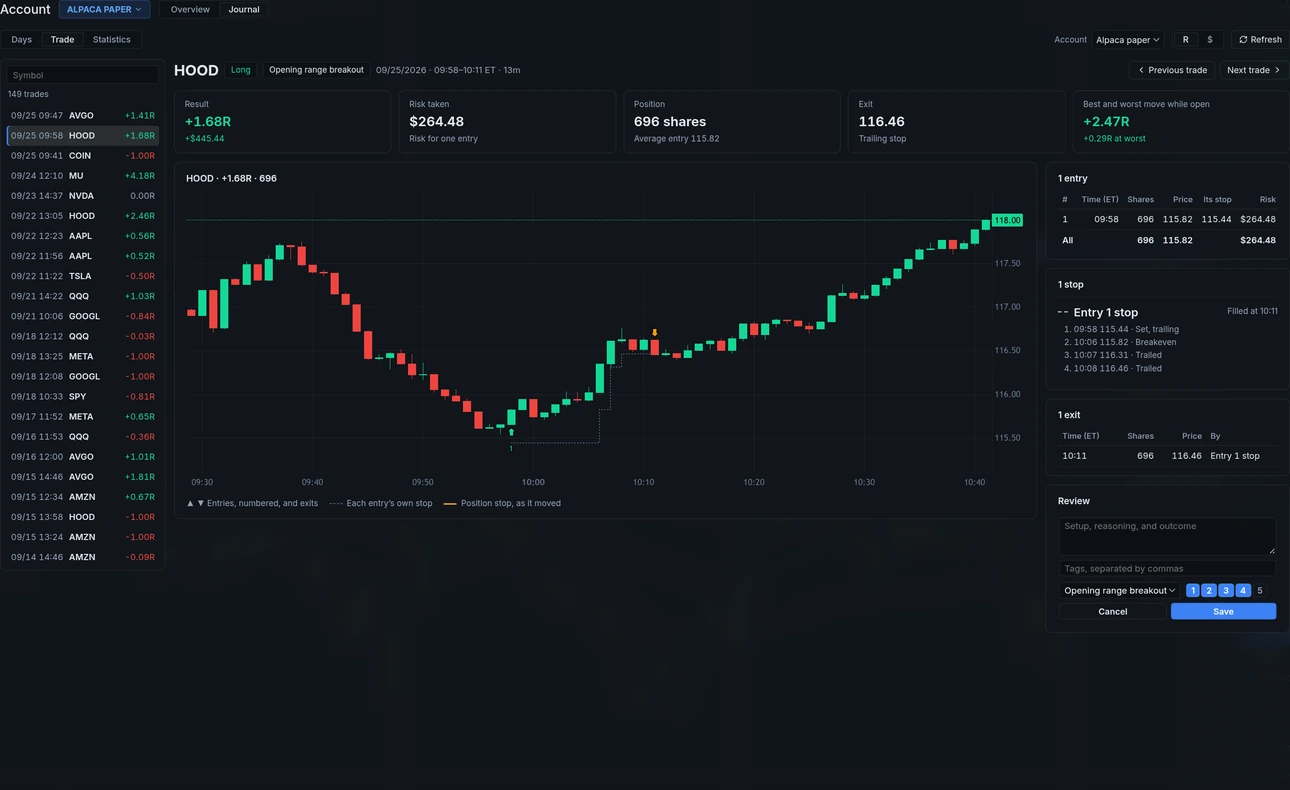
The journal assembles trades from recorded events, with entry, original stop, stop changes and exit where available.
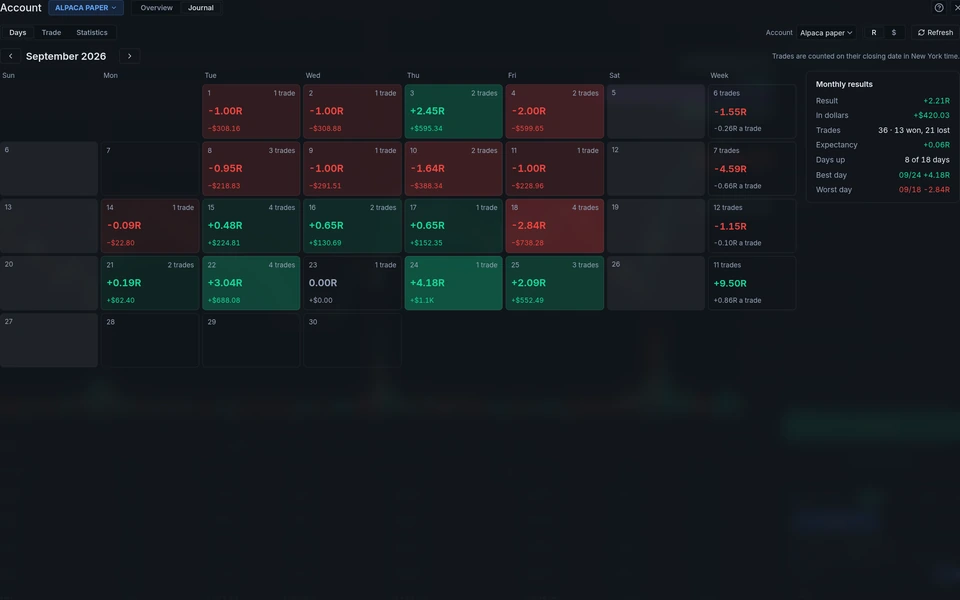
View daily and weekly results in R multiples or dollars.
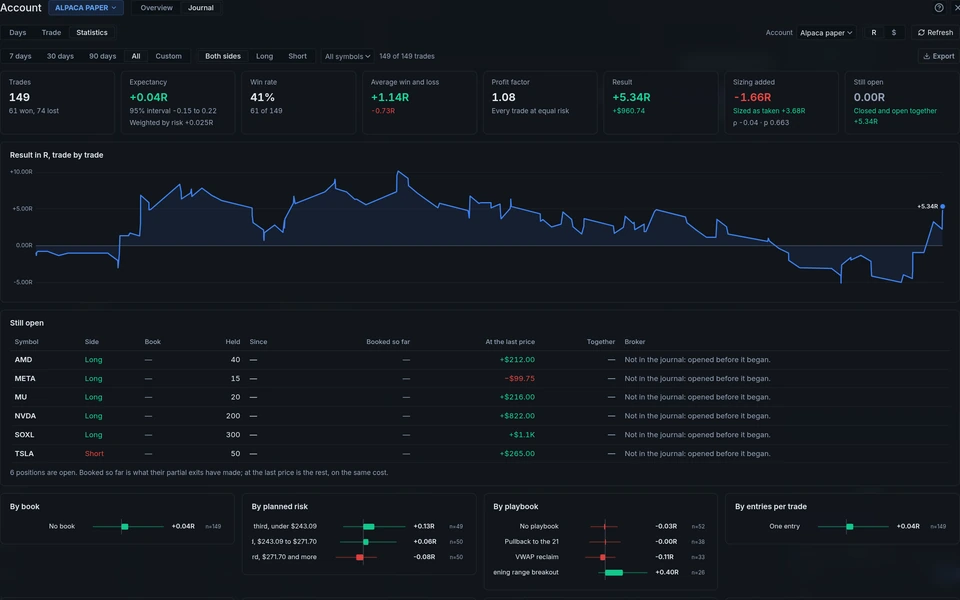
Review expectancy, win rate and profit factor by sub-account, position size, playbook, time of day or trade direction.
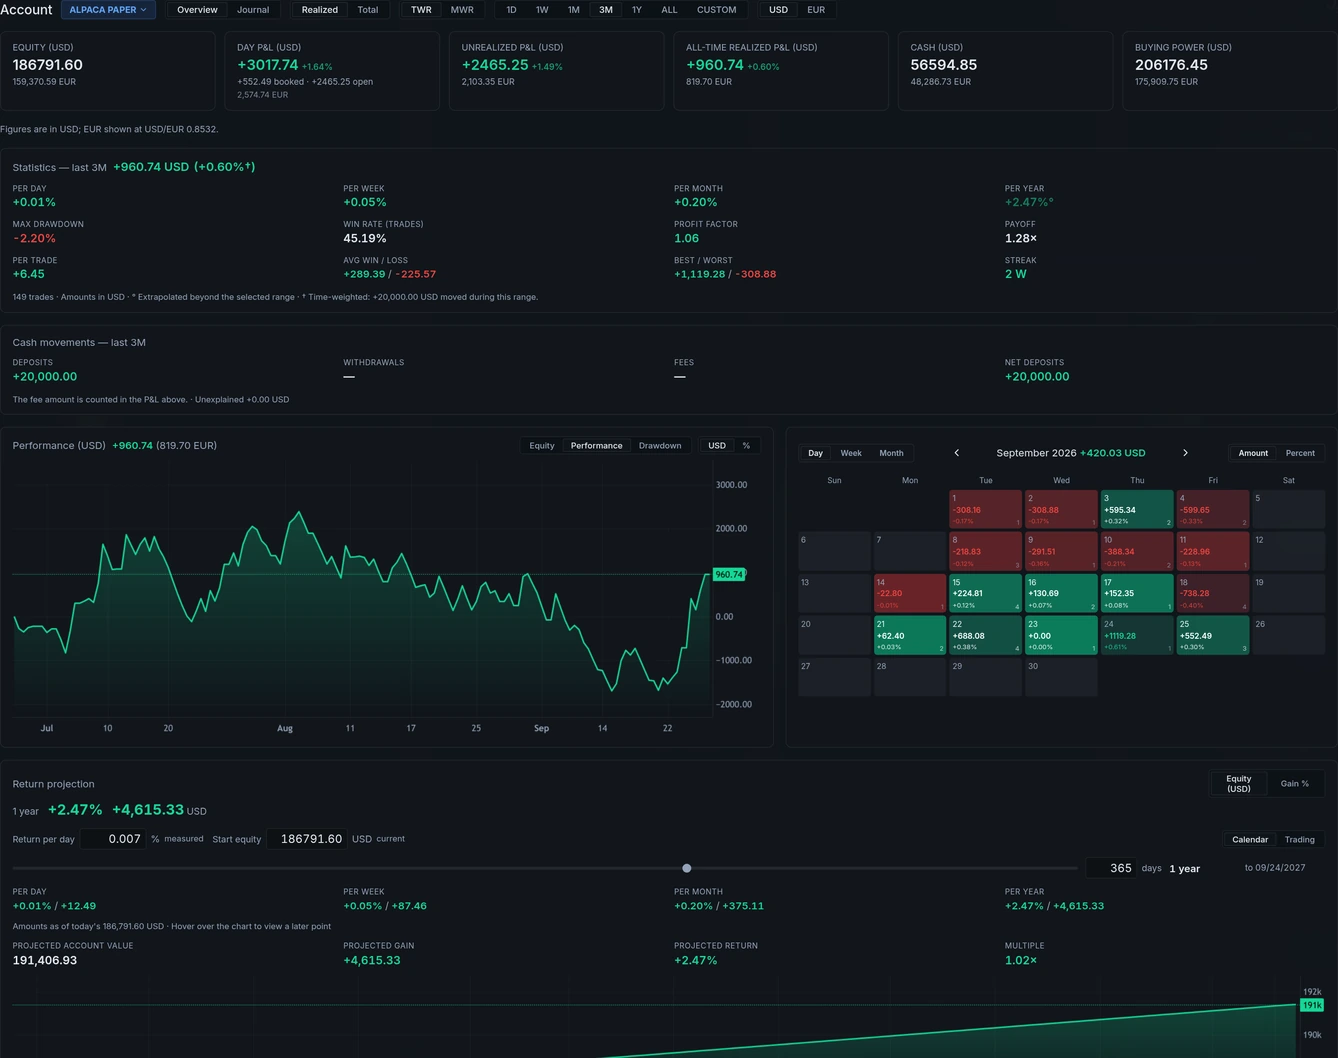
Equity and P&L over any range, time- or money-weighted returns, and deposits and fees kept out of performance.
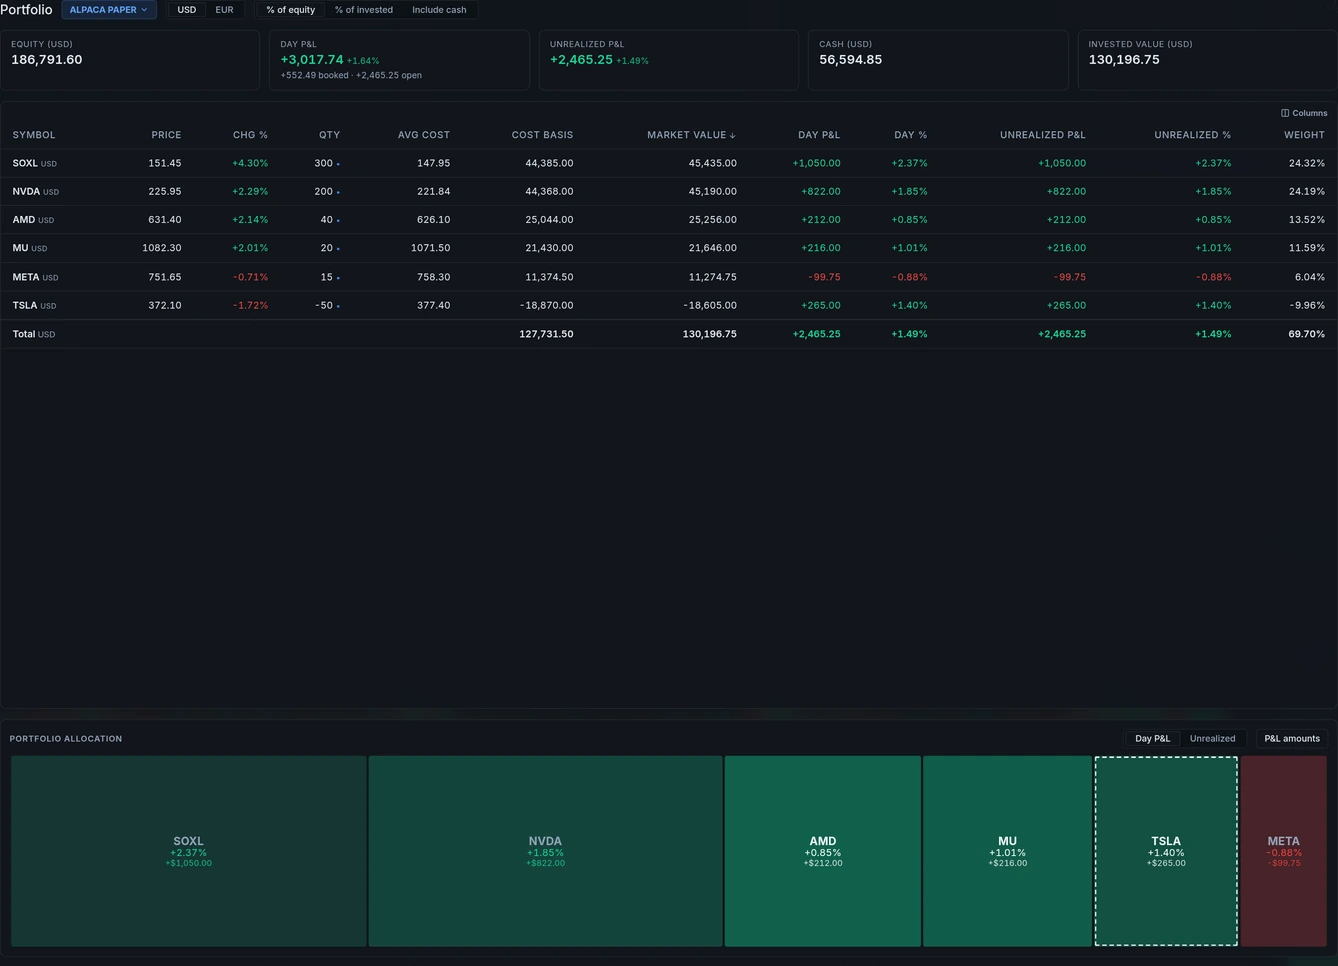
View day and unrealized P&L, portfolio weight and company data for each position, plus an allocation map.
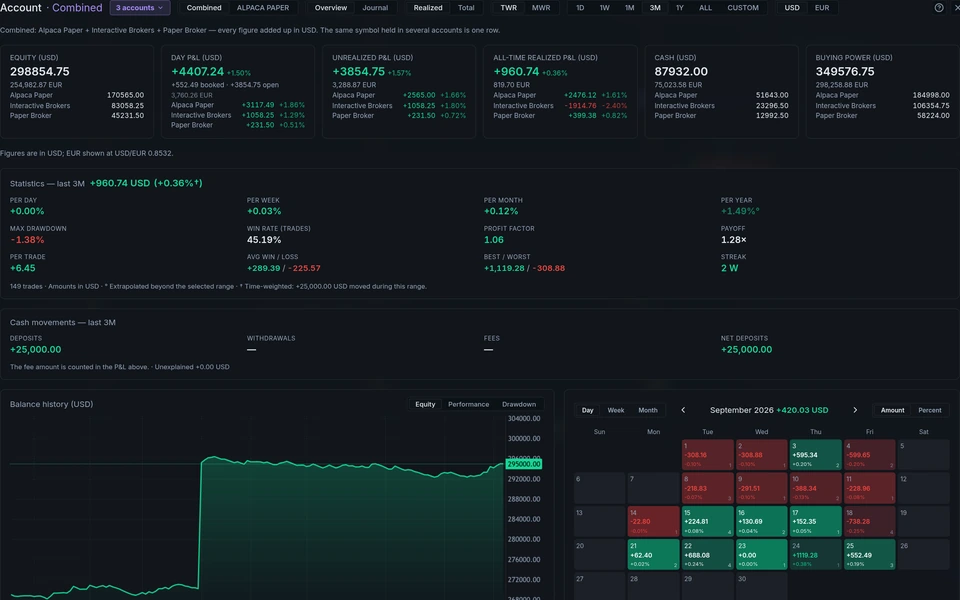
Select two or more accounts in the Account or Portfolio page picker to see combined figures. Figures use the currency of the first account selected, and each tile shows each account’s contribution. Accounts that cannot be loaded or converted are named and left out. Orders still go to the active account.
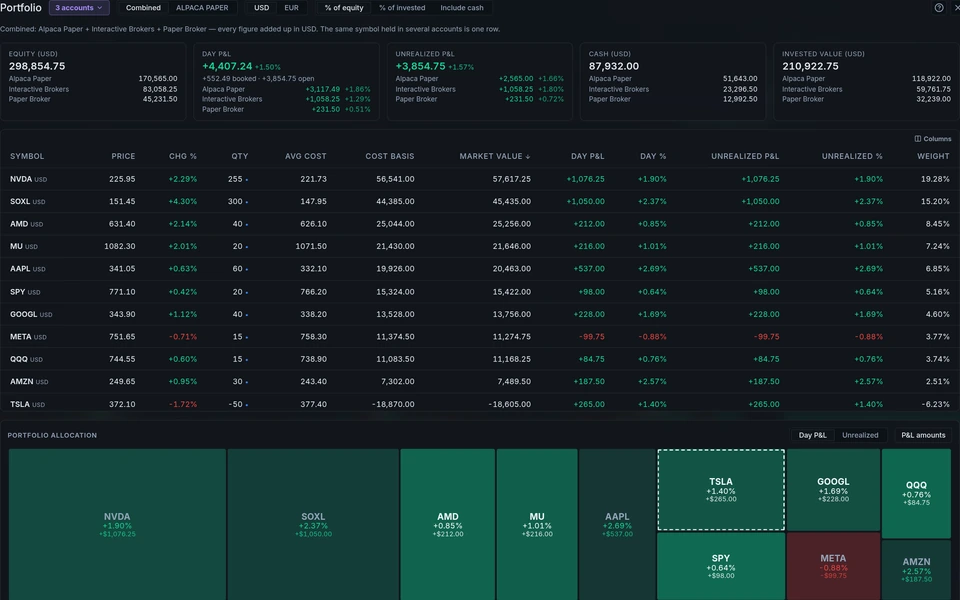
Positions in the same symbol appear in one row, with a blended cost. The tiles and allocation map show the combined portfolio, and each tile lists each account’s contribution.
Use virtual sub-accounts, called books, to separate budgets and results within one broker account. Positions, buying power and margin remain part of that broker account.
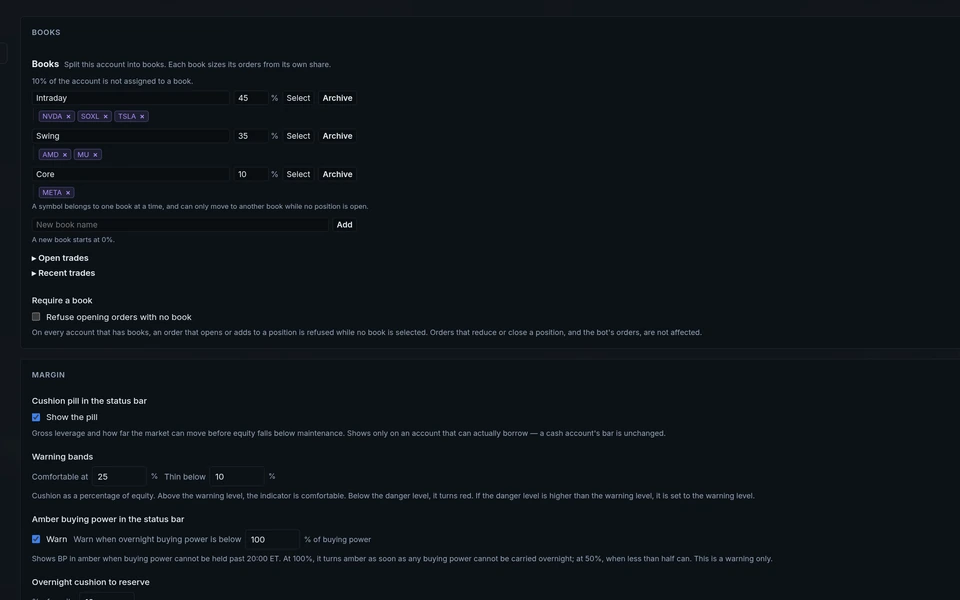
Name each book and assign it a share of the account. A symbol belongs to one book at a time; move it to another only when no position is open. You can require a book before opening a position.
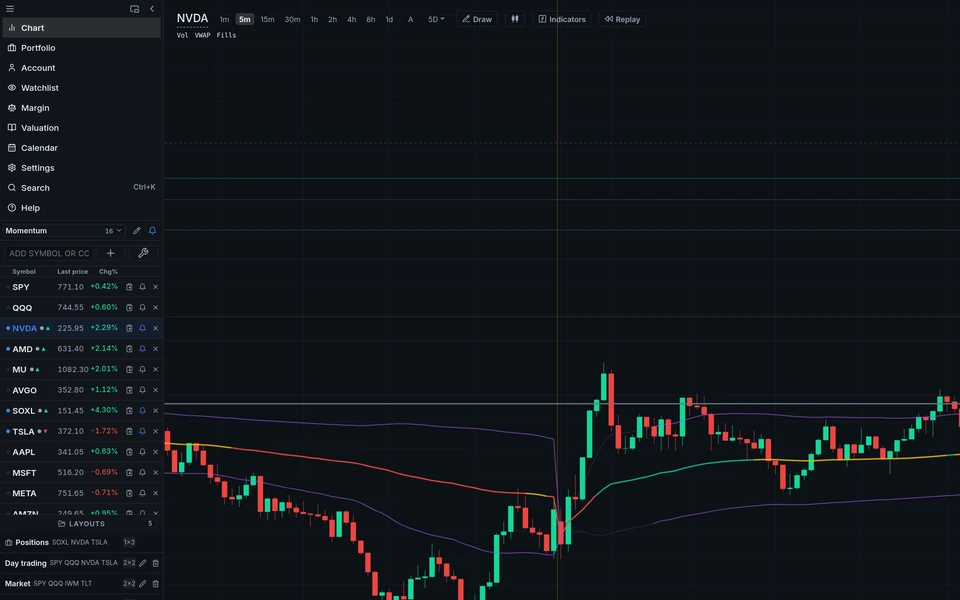
Select a book to see the budget in the status bar. Risk-based and one-key sizing use the book’s share of the account and the reported buying power. Available buying power can change before an order reaches the broker. Tables show that book’s positions and results.
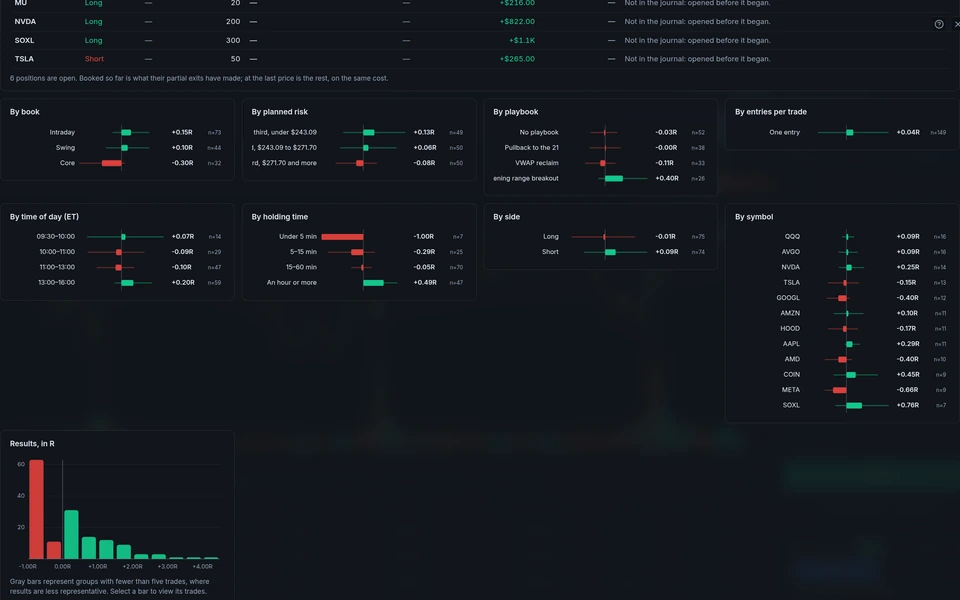
View journal statistics, account results and portfolio positions for one book or all books together.
Build watchlists, follow unusual moves and news, see market-risk readings, and view company valuation.
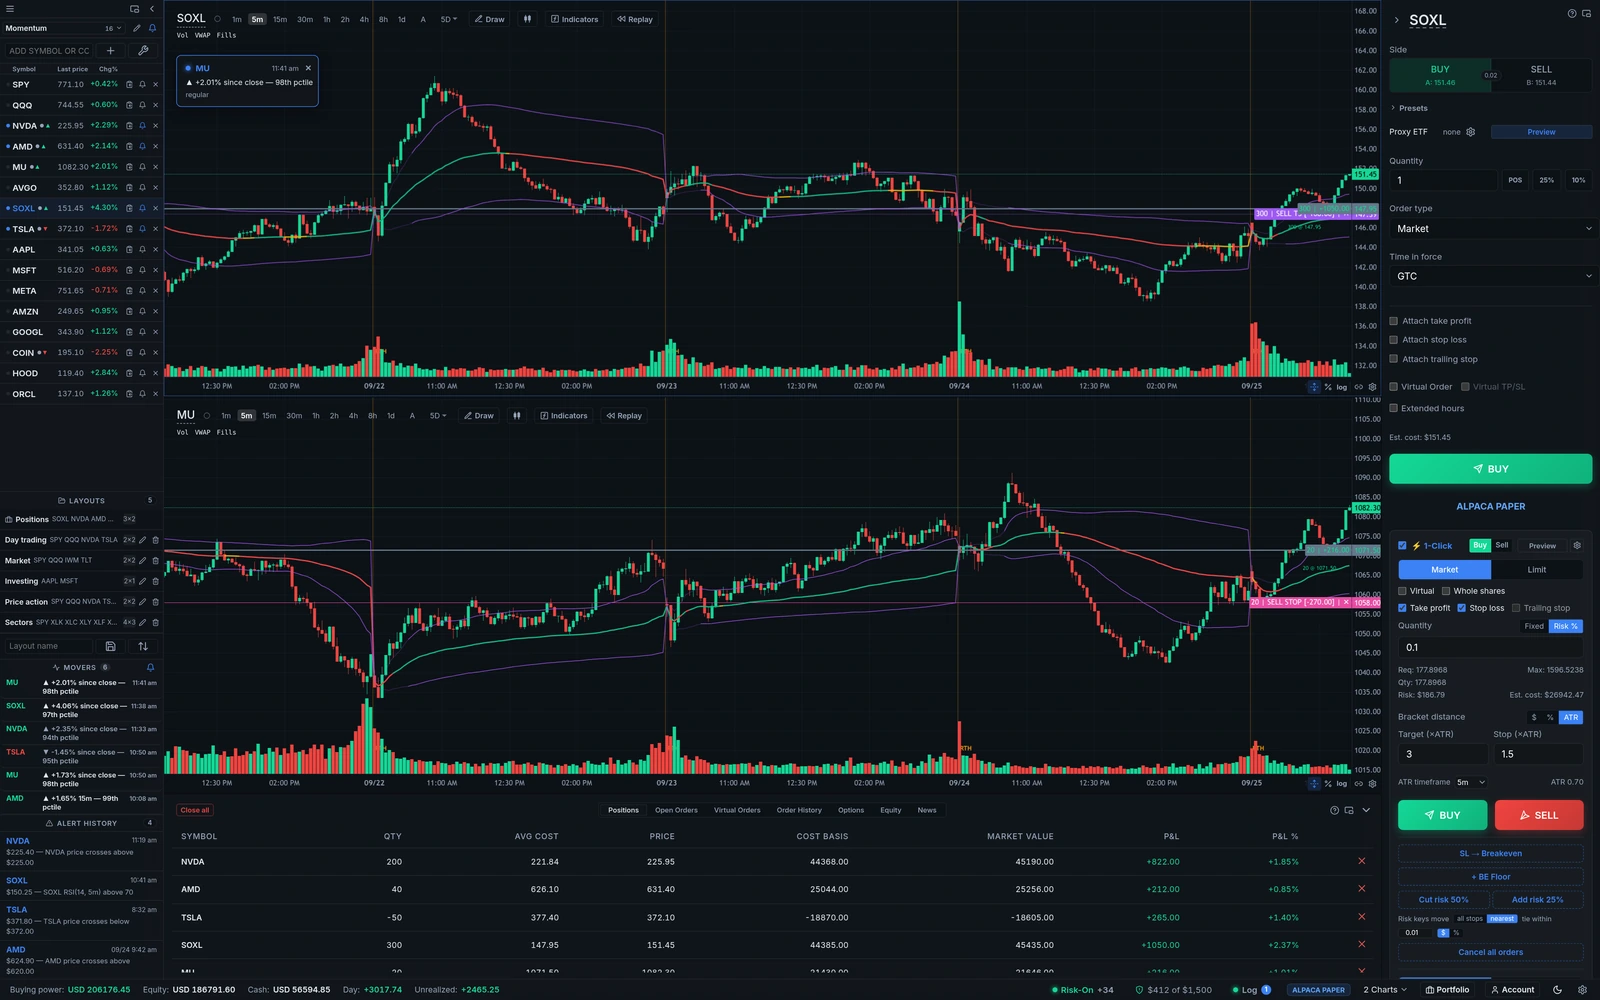
Compare price moves with the same symbol’s past moves at the same time of day.
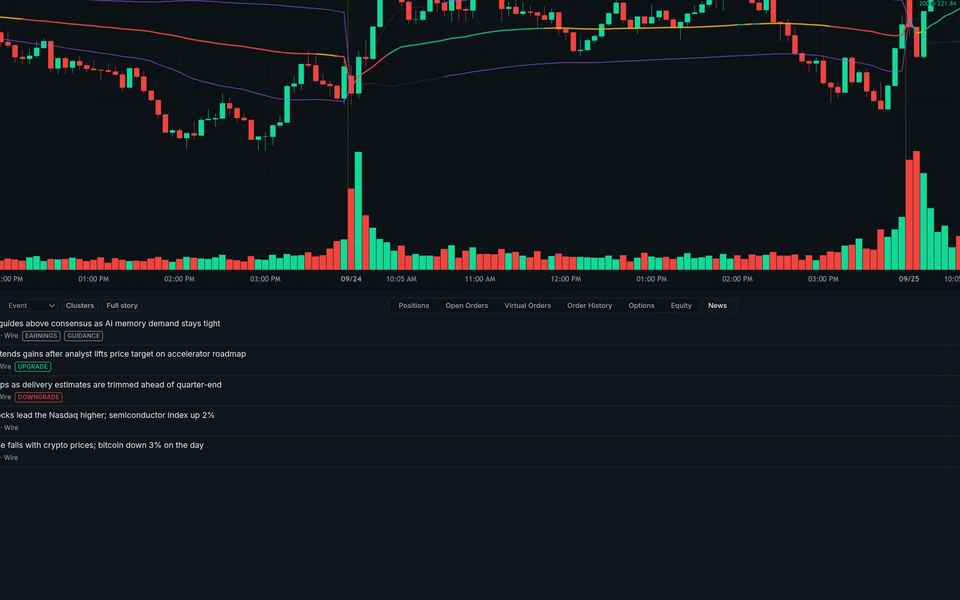
Read watchlist news tagged by event and sentiment. Get an alert when headlines for one symbol arrive in a burst.
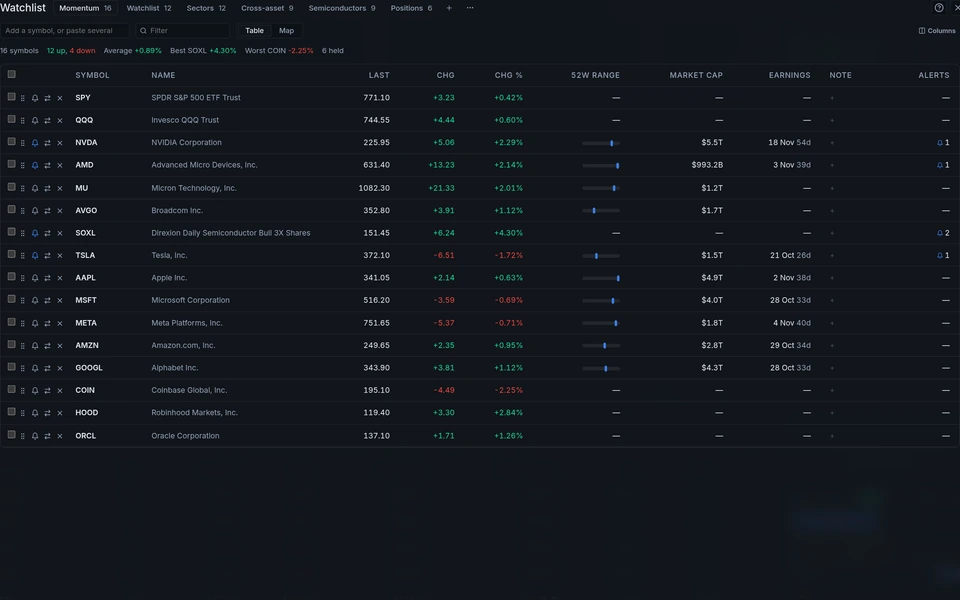
Sort the watchlist by any column and view a map of the day’s moves. For a selected symbol, Prompt Builder inserts current figures into a prompt ready to copy to an AI assistant.
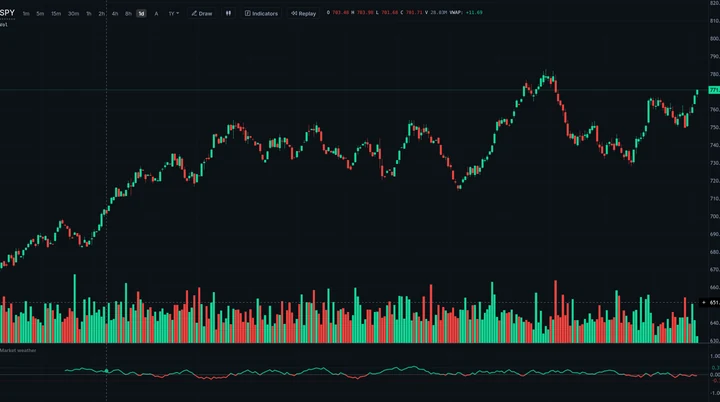
Market weather summarizes seven cross-asset measures as risk-on, neutral or risk-off.
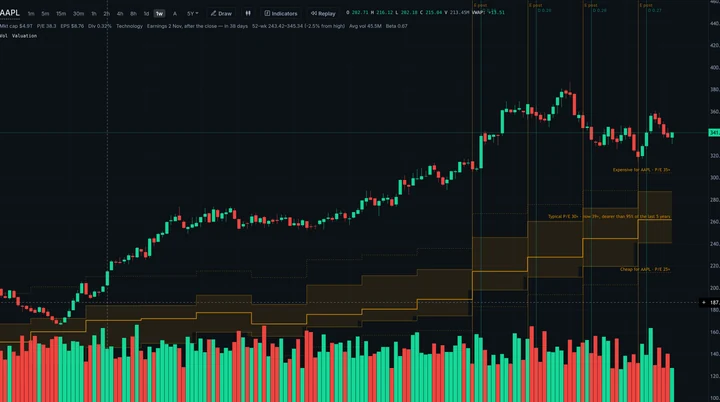
For US companies, see the current P/E against its historical range, SEC-filed reports, dividends and key statistics.
See current margin use, your available cushion and the change from intraday to overnight requirements.
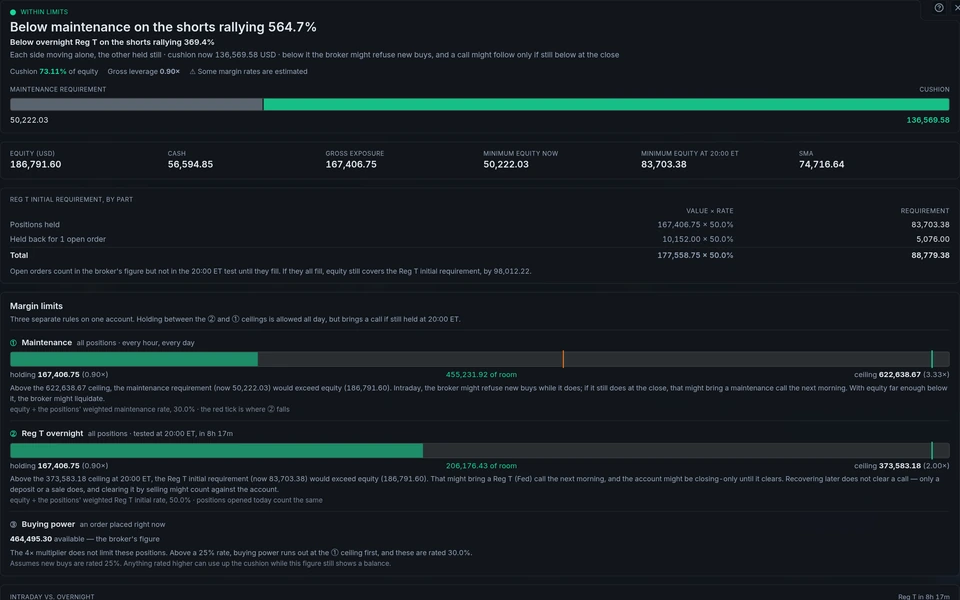
Compare intraday and overnight limits, see margin used by each position, and receive alerts before the overnight requirement applies.
TapeVision runs on your computer with the broker and market-data accounts you connect.
The beta installs on all three. The built-in paper broker needs no account.