Sectors
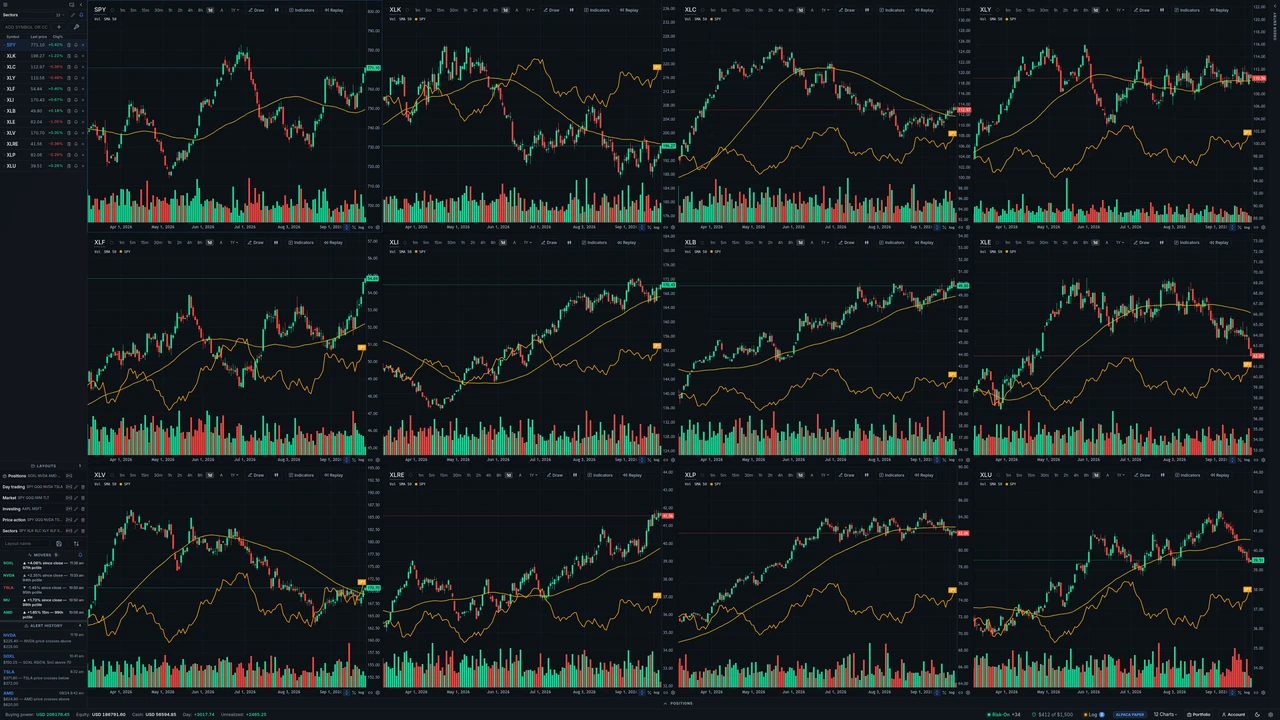
Eleven sector funds in a four-by-three grid, each compared with SPY.
Set up your workspace with layouts, chart templates, panels on another screen, palettes, colors, drawing tools and keyboard shortcuts. Select a screenshot to enlarge it.
A new install includes layouts and chart templates for day trading, price action, sectors and investing. Change any layout, save your own grid and settings, or clear the defaults and start from scratch.
Eleven sector funds in a four-by-three grid, each compared with SPY.
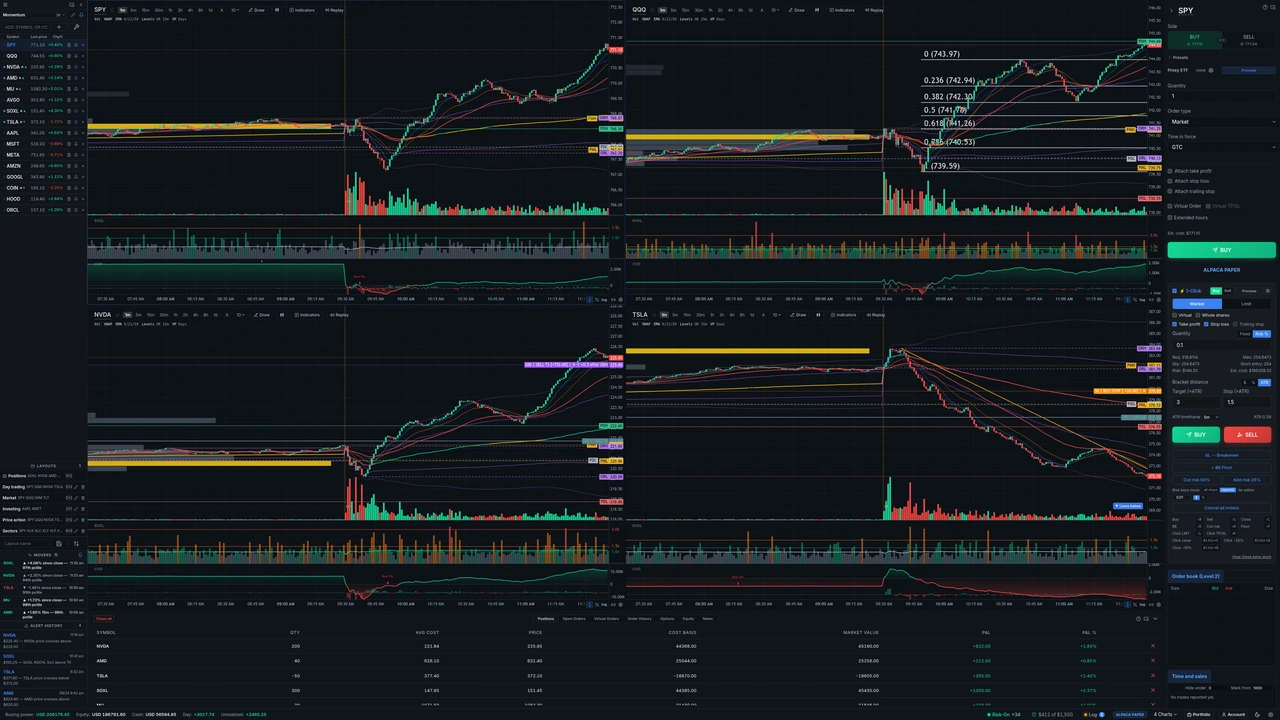
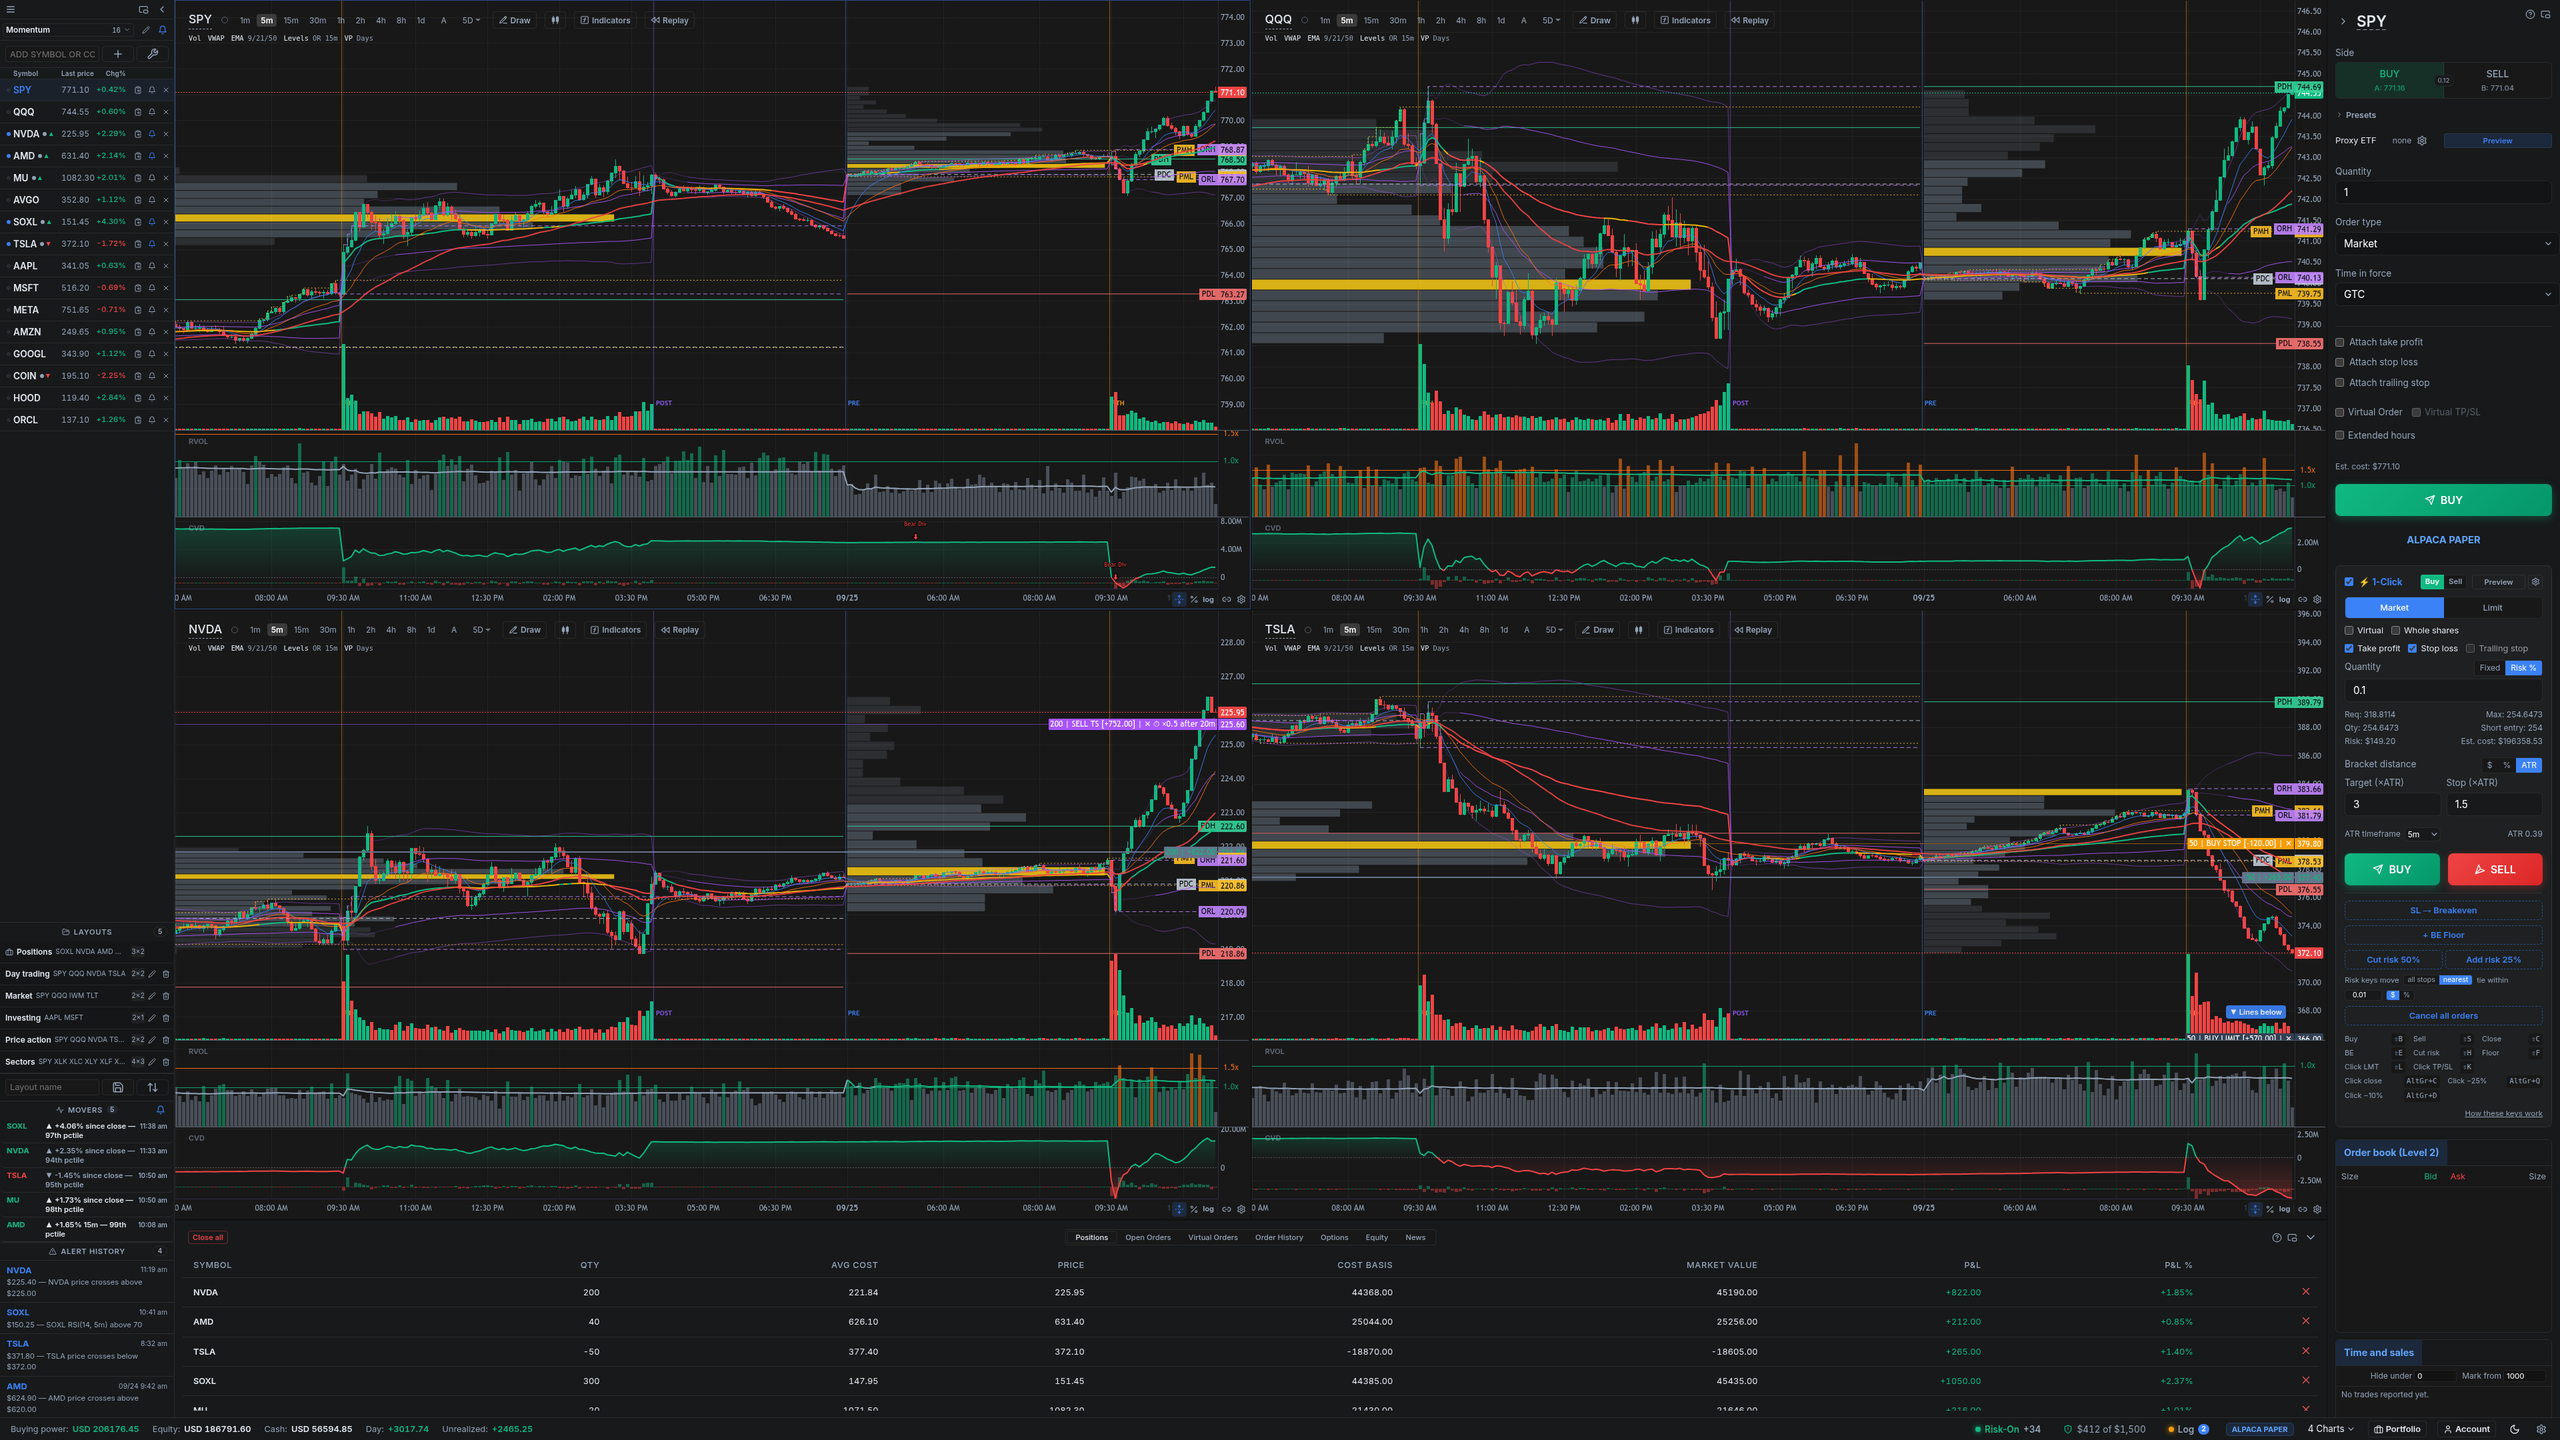
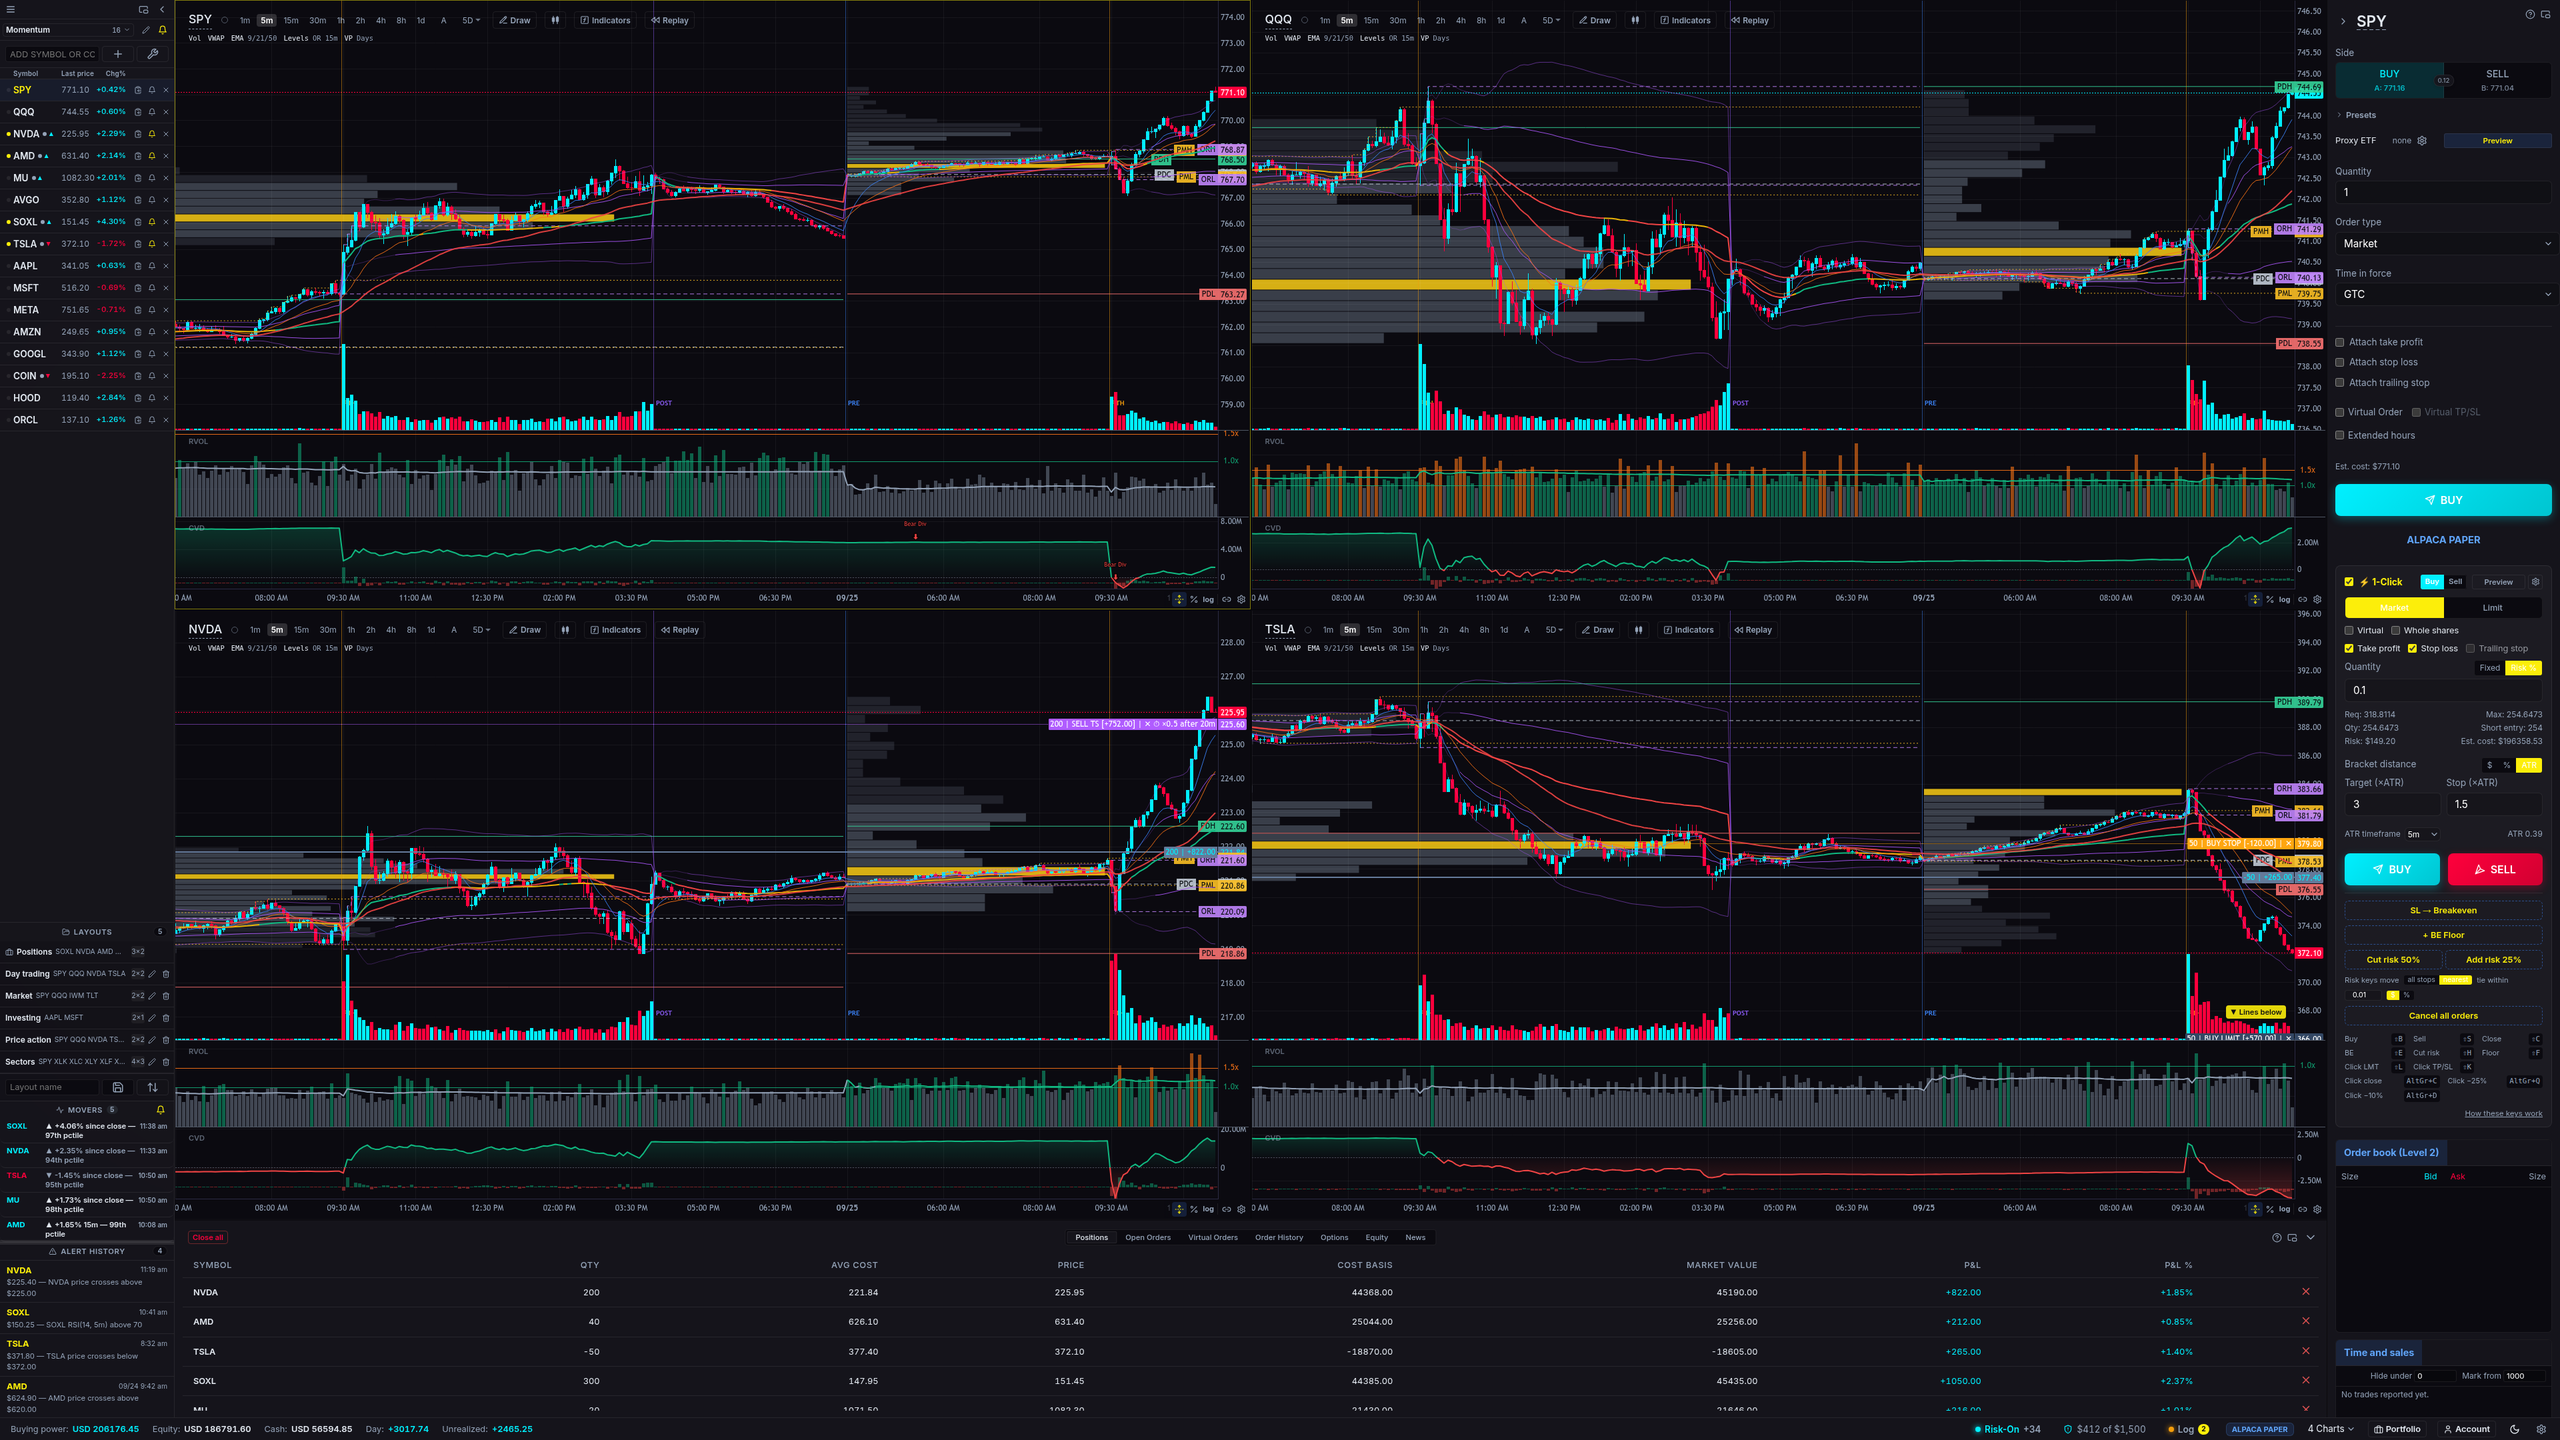
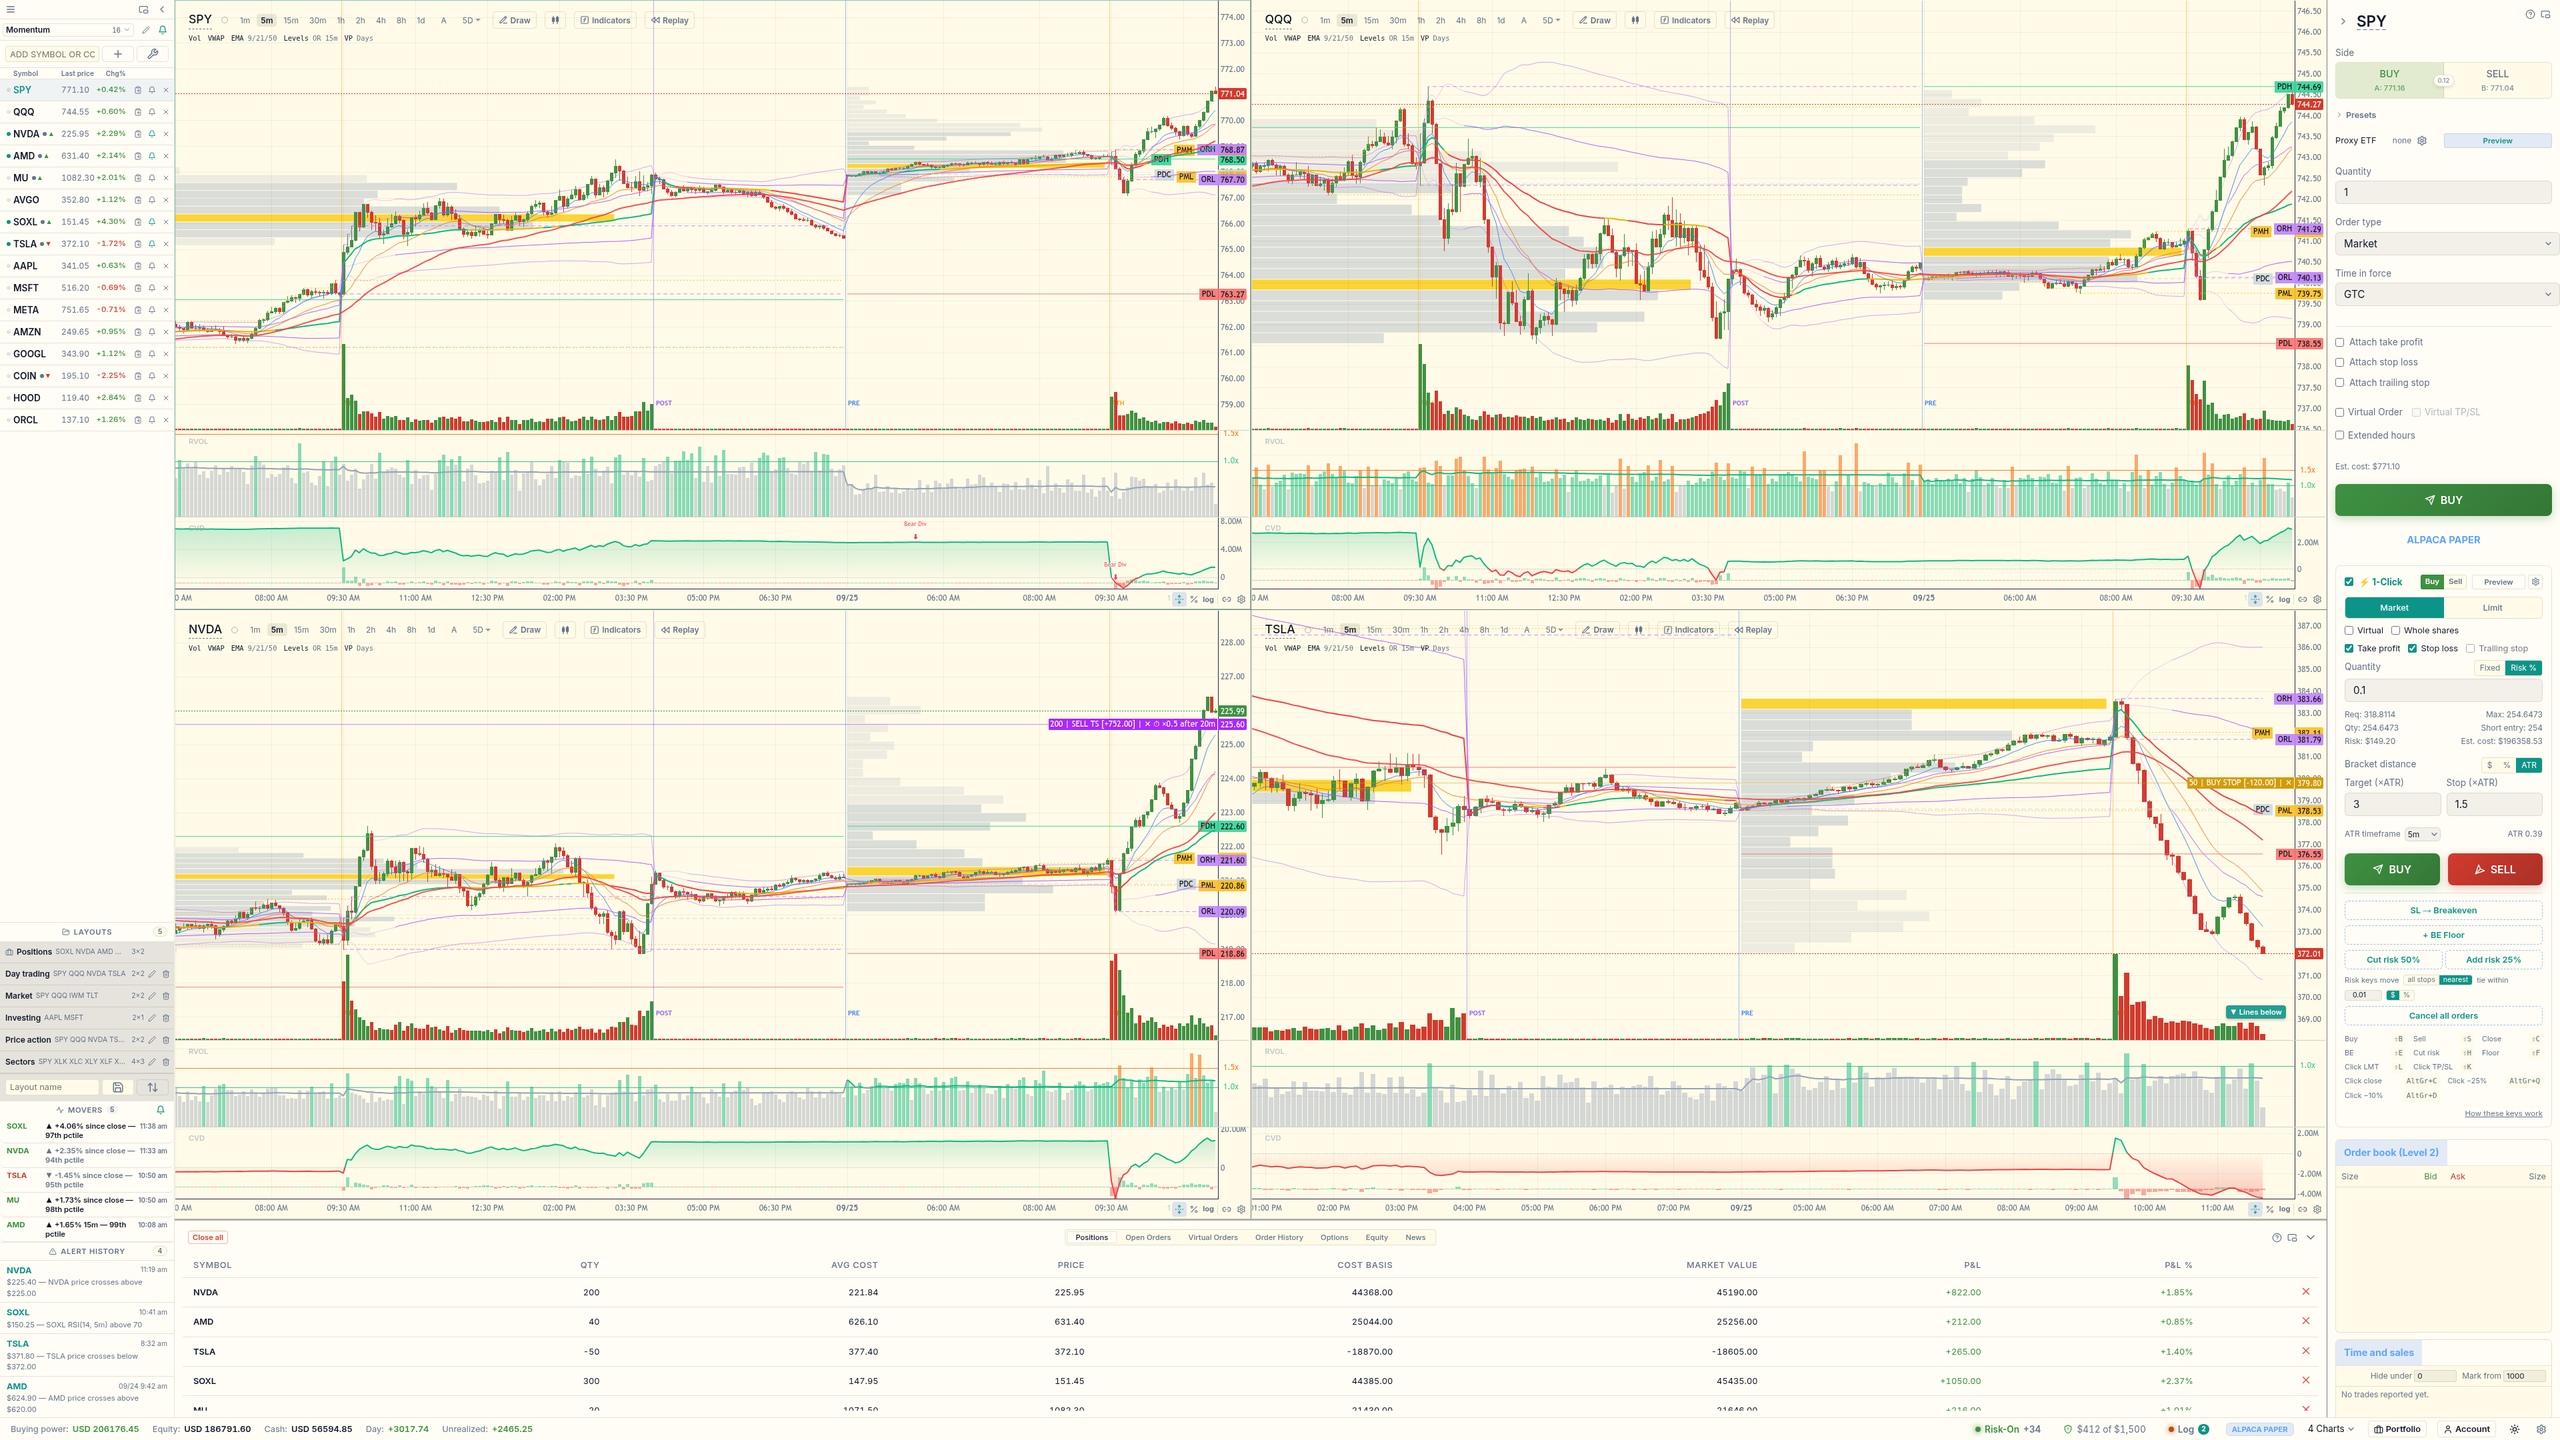
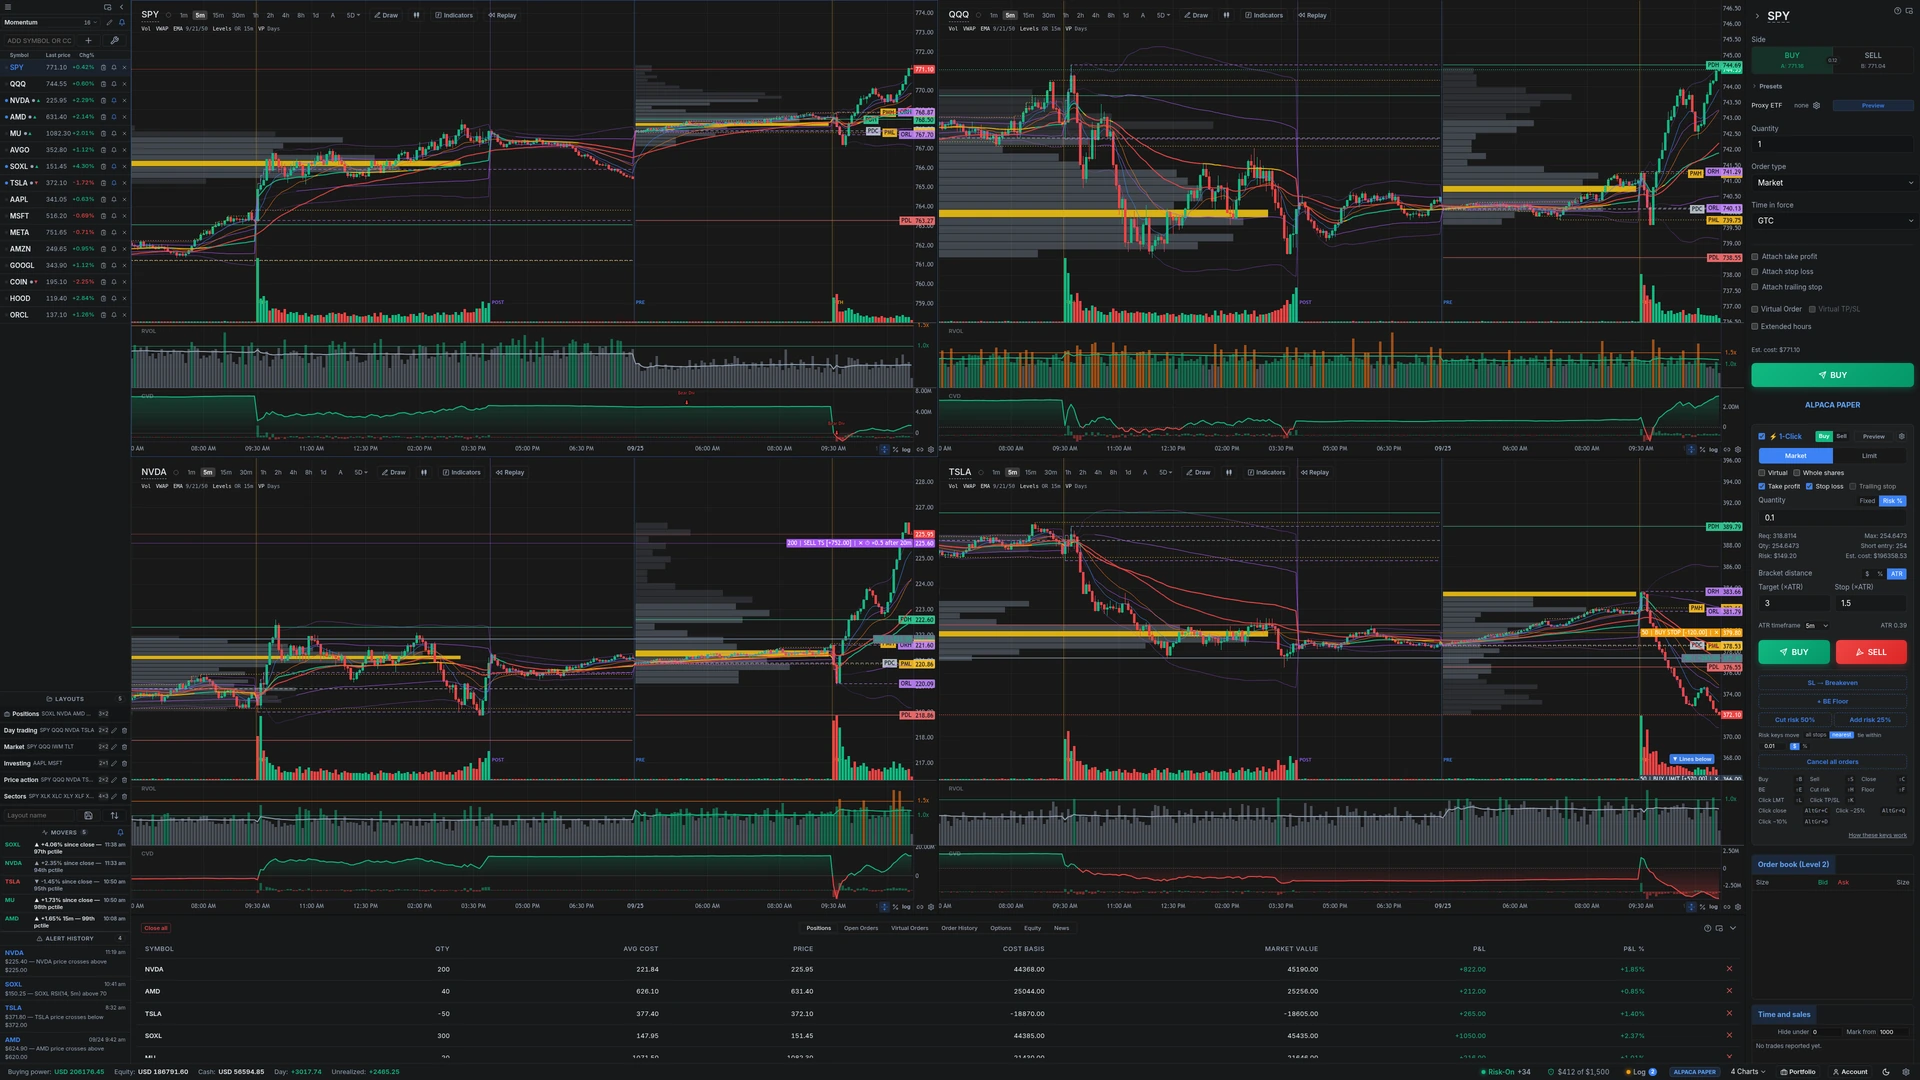
Minute charts for SPY, QQQ, NVDA and TSLA with VWAP bands, moving averages, key levels and session volume profiles.
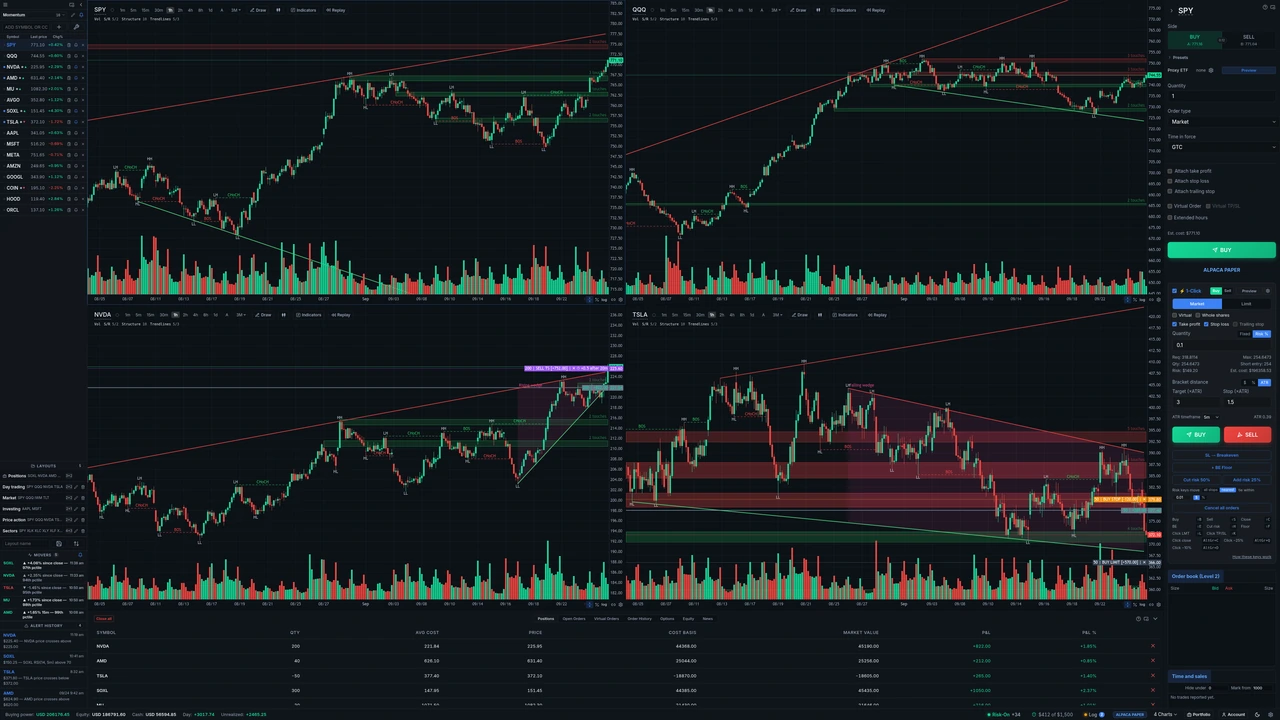
SPY, QQQ, NVDA and TSLA with support and resistance zones, market structure and trendlines.
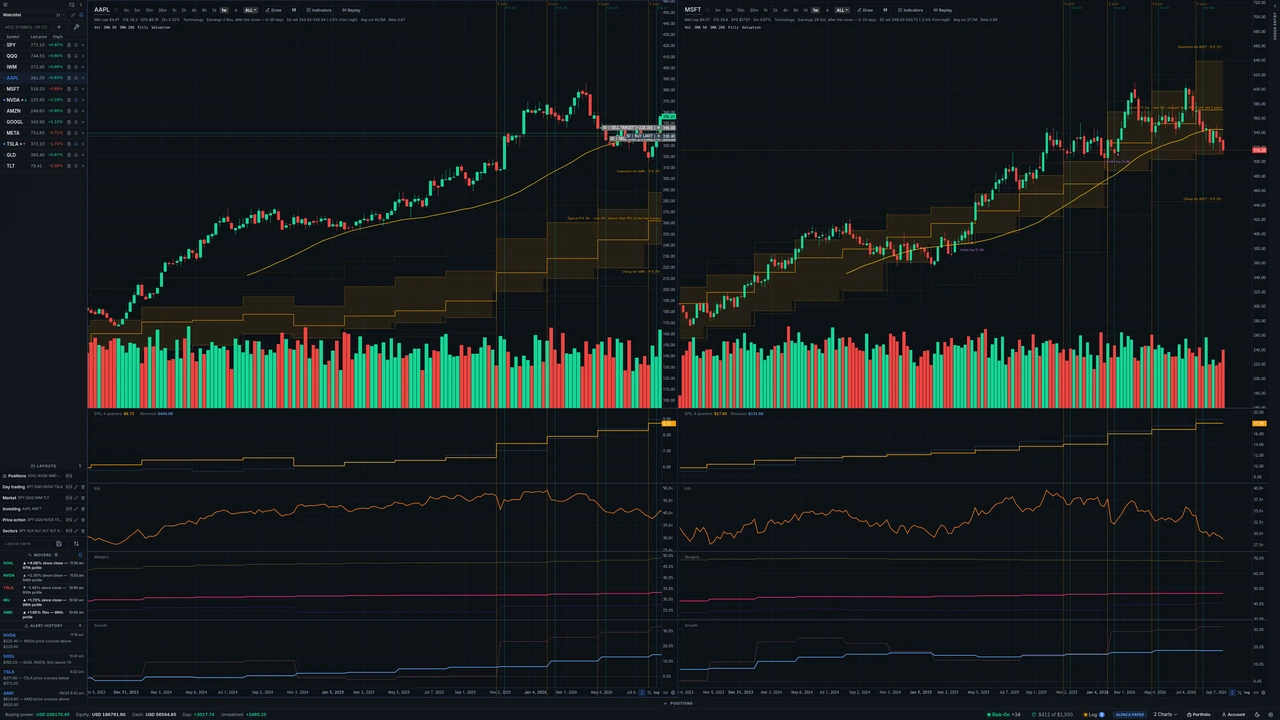
Compare two companies with valuation bands and reported figures for earnings, revenue, P/E, margins, growth and insider purchases.
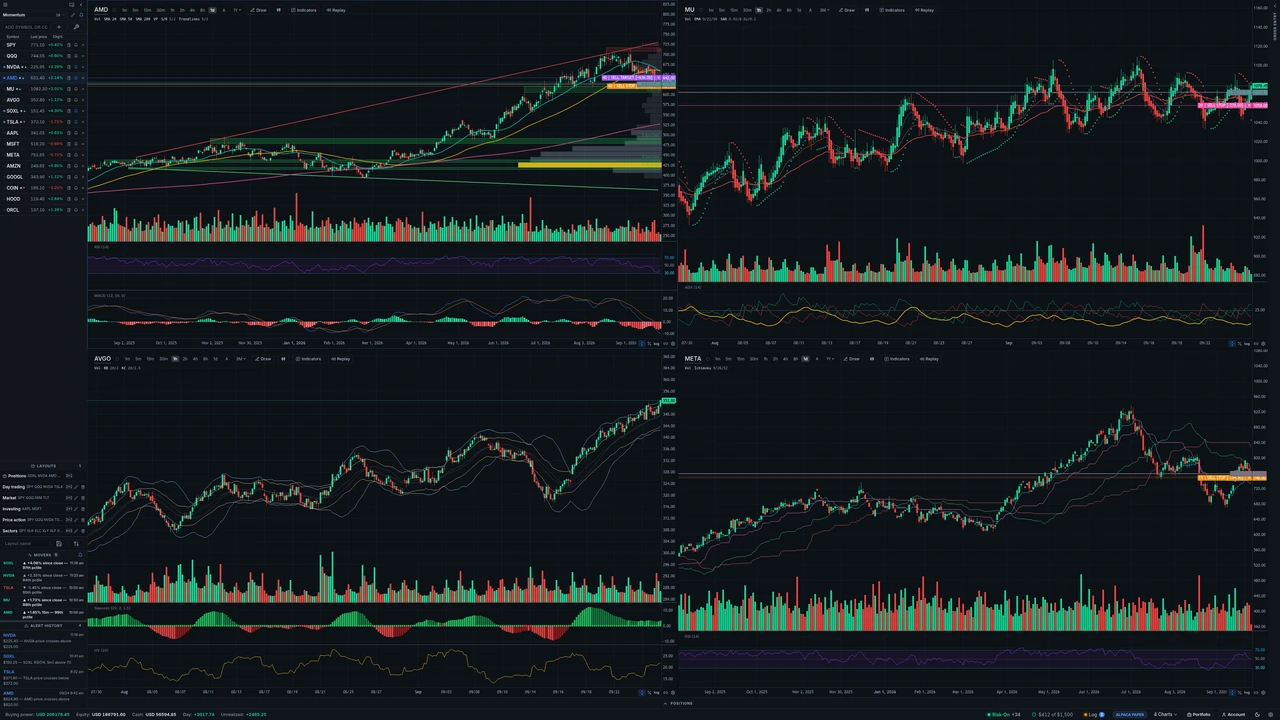
Choose a Swing, Heikin Ashi, Volatility squeeze or Ichimoku template to set up a chart. Save your own templates for later.
Move the watchlist, order ticket and position tables into separate windows on another screen.
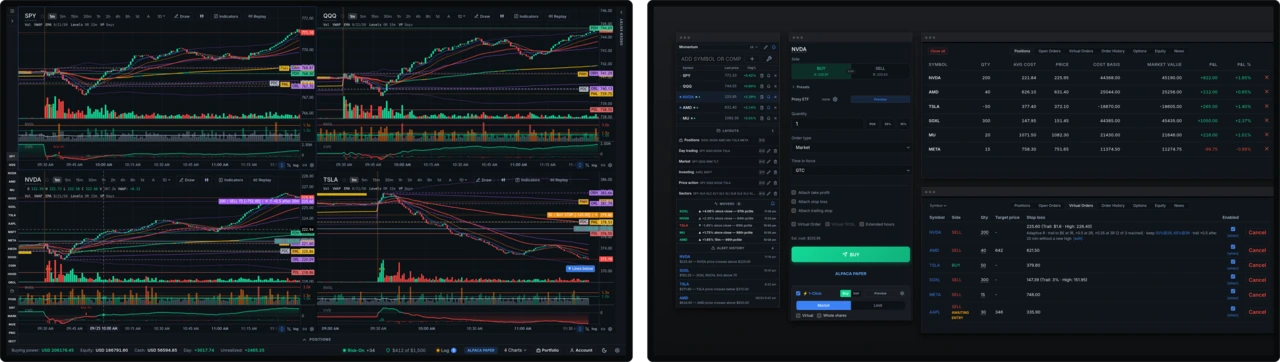
Open the watchlist, order ticket or position tables in separate windows and move them to another screen. Keep charts on one screen and positions or virtual orders on the other.
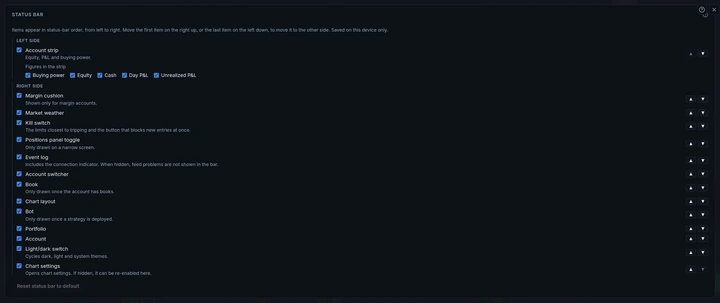
Show, hide and reorder status-bar items including buying power, P&L, margin, market weather and the kill switch.
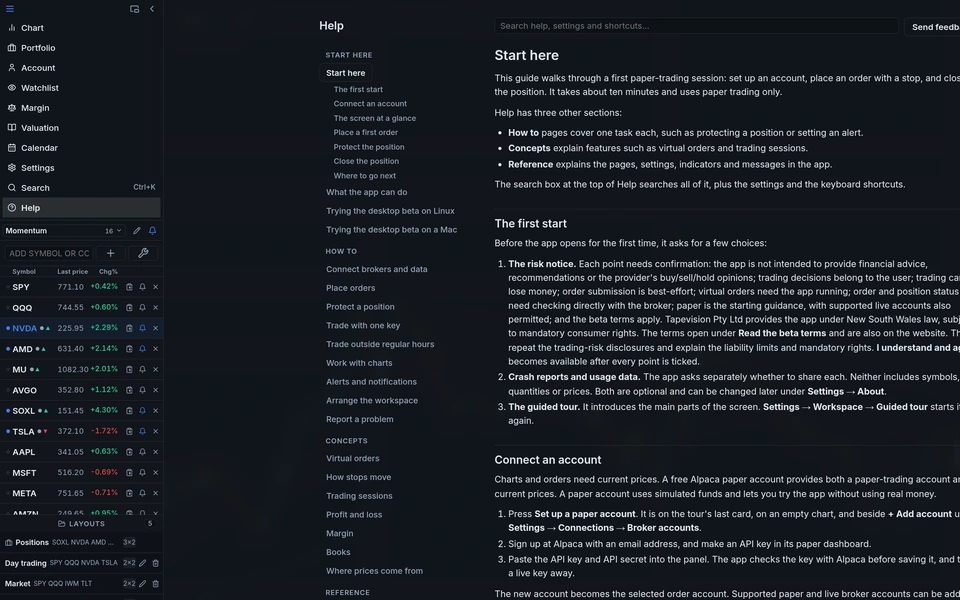
Search the manual, settings and shortcuts from Help. Open Help beside the charts to keep trades in view.
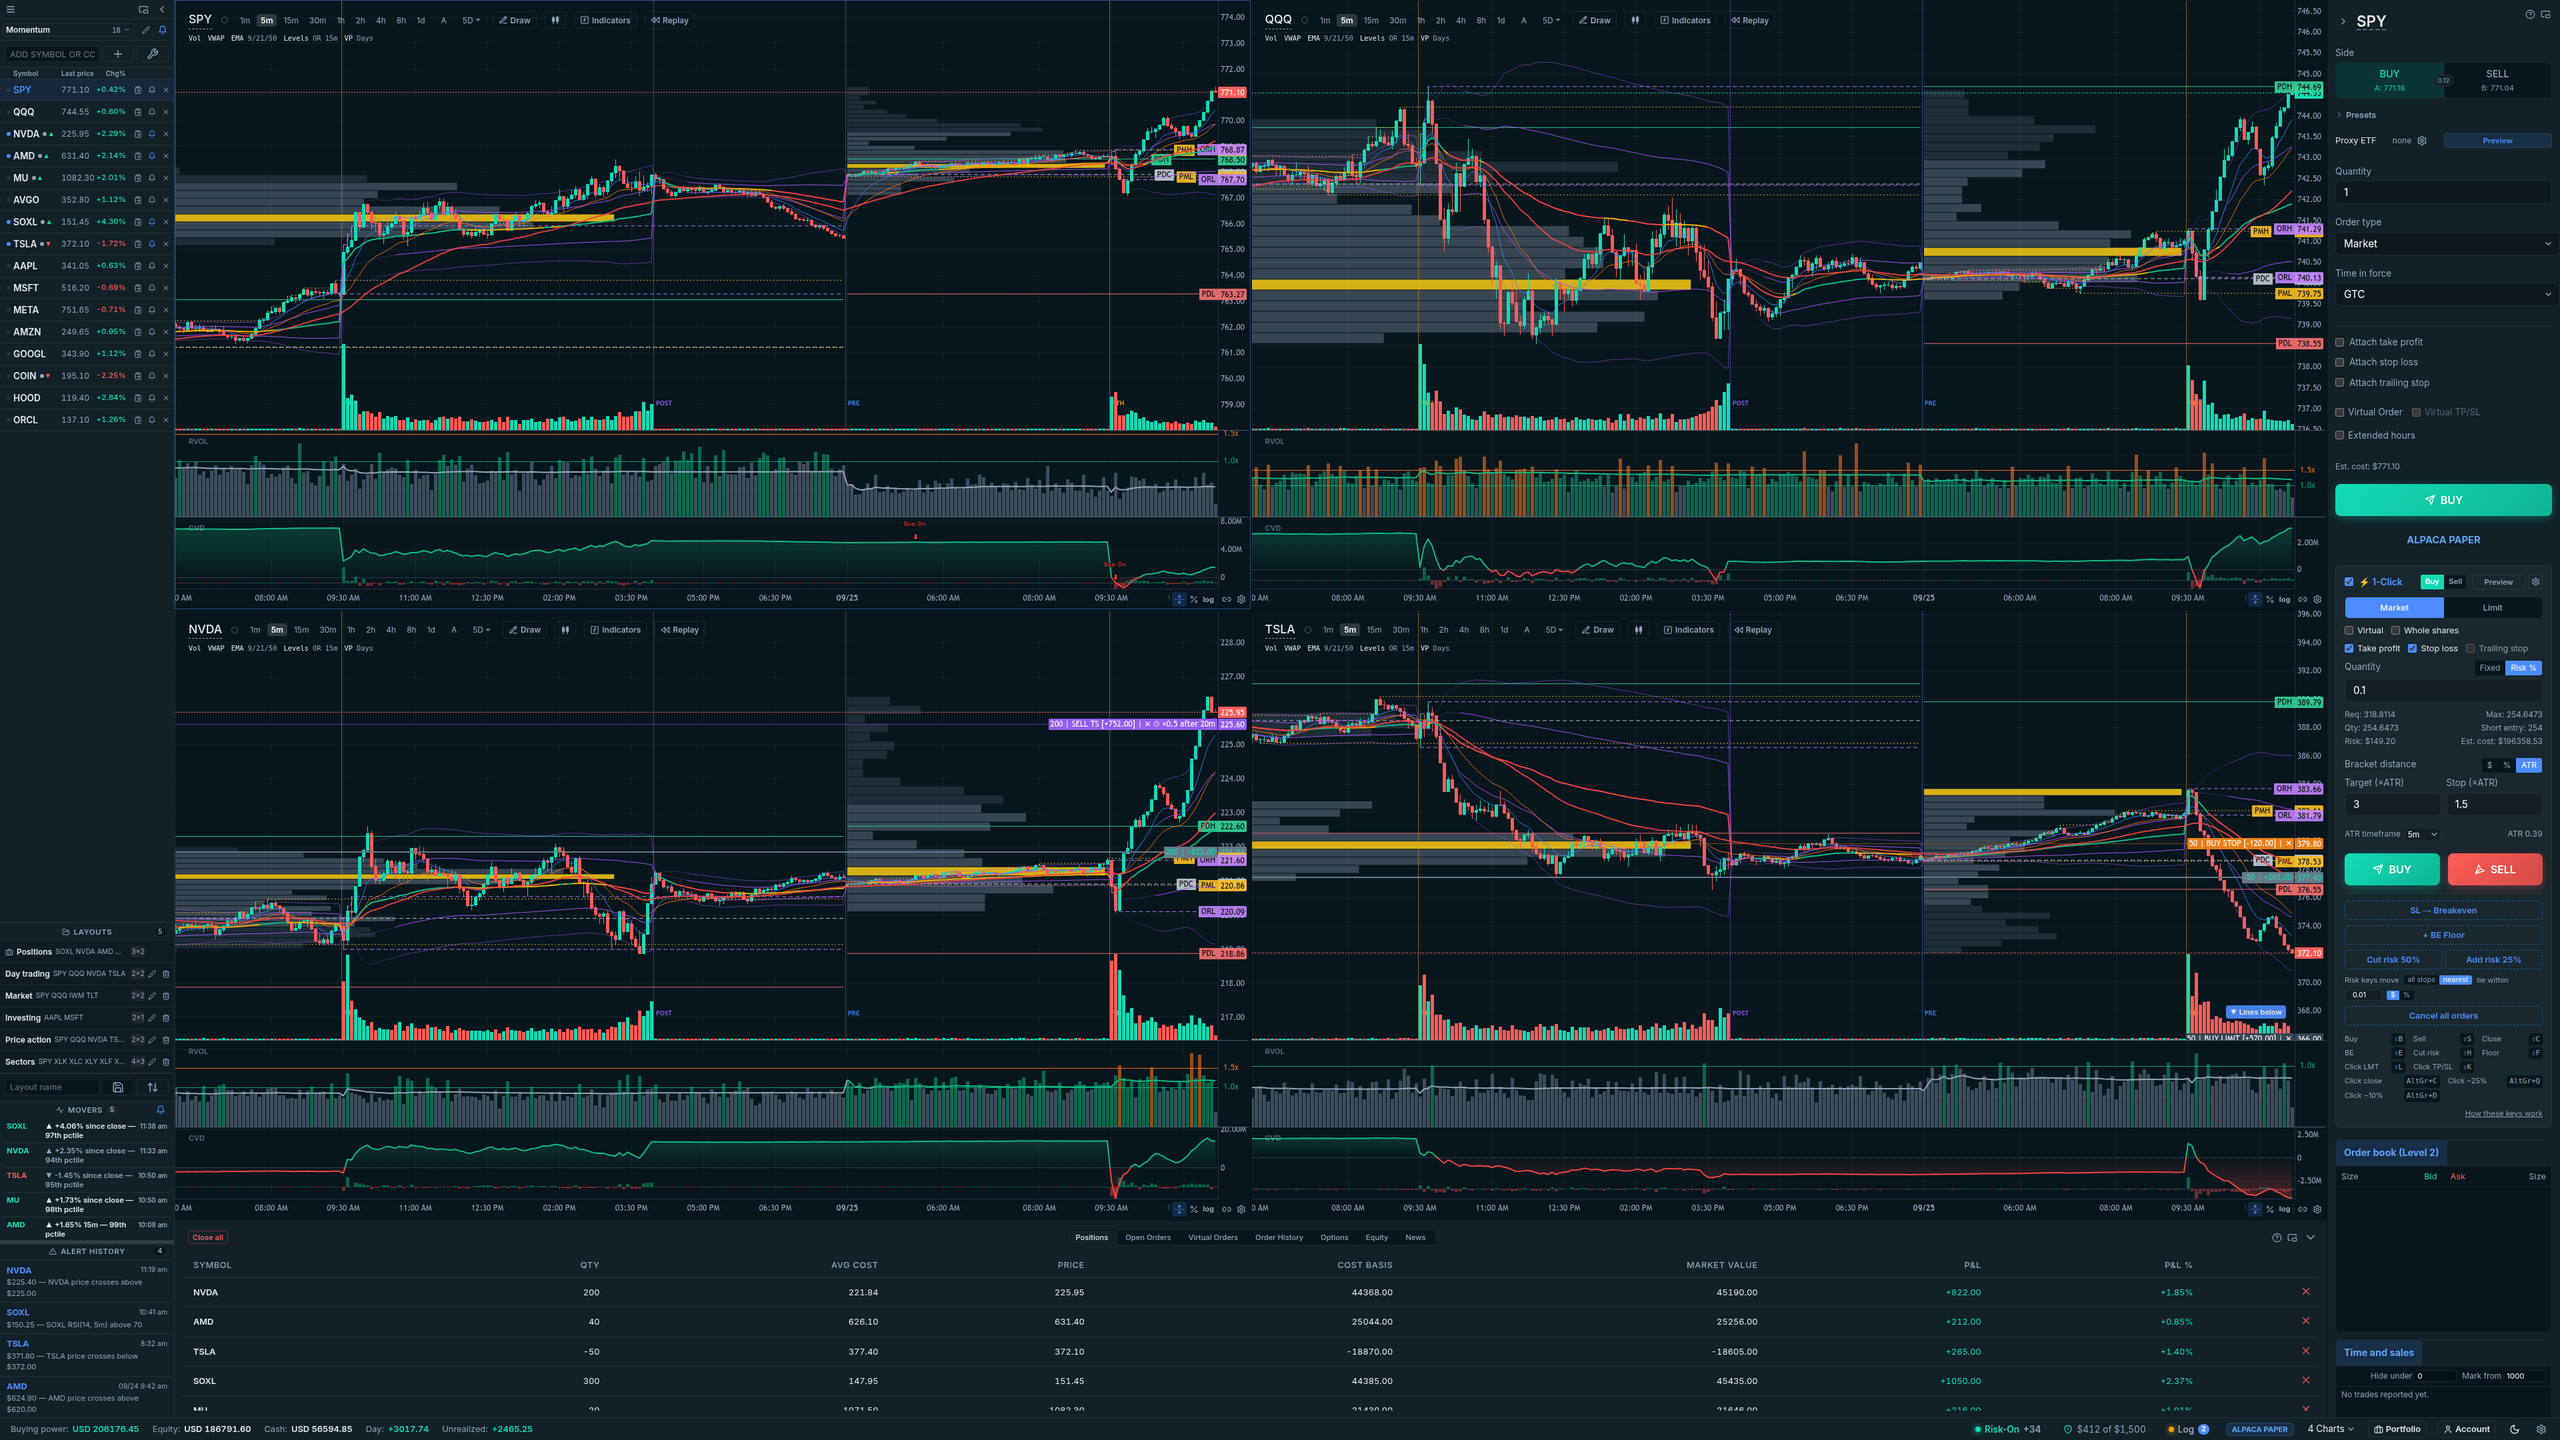
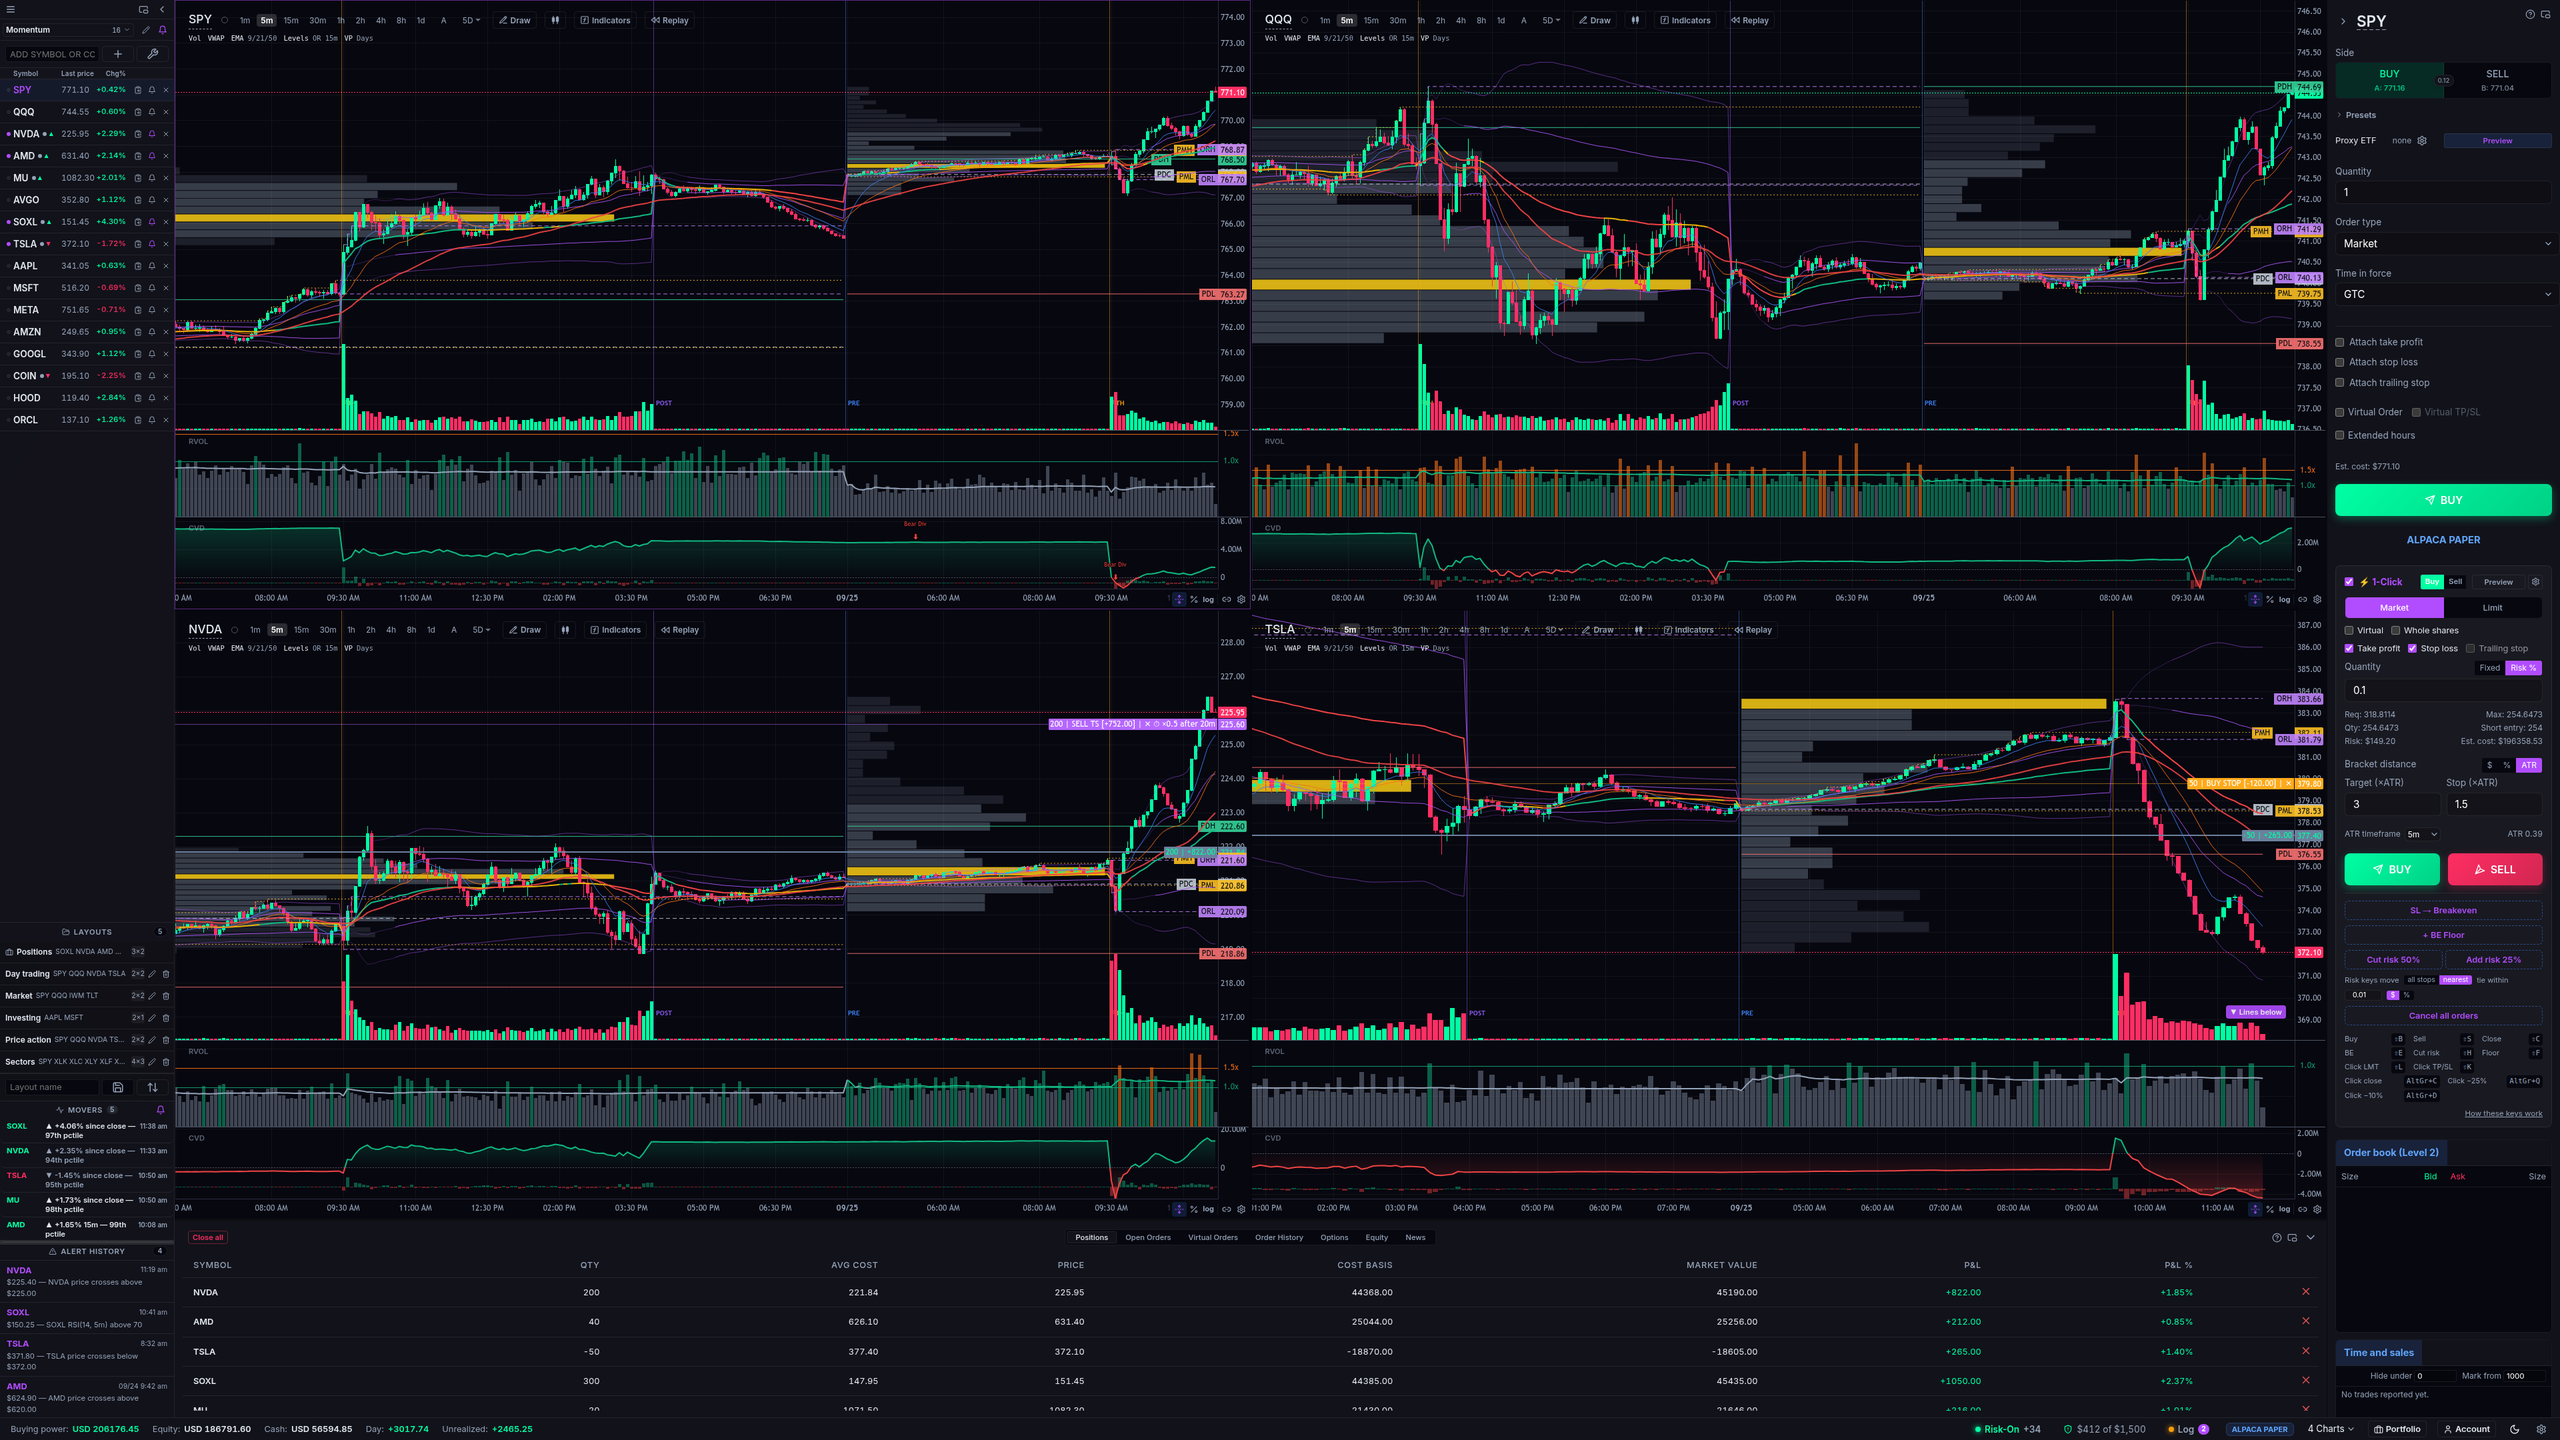
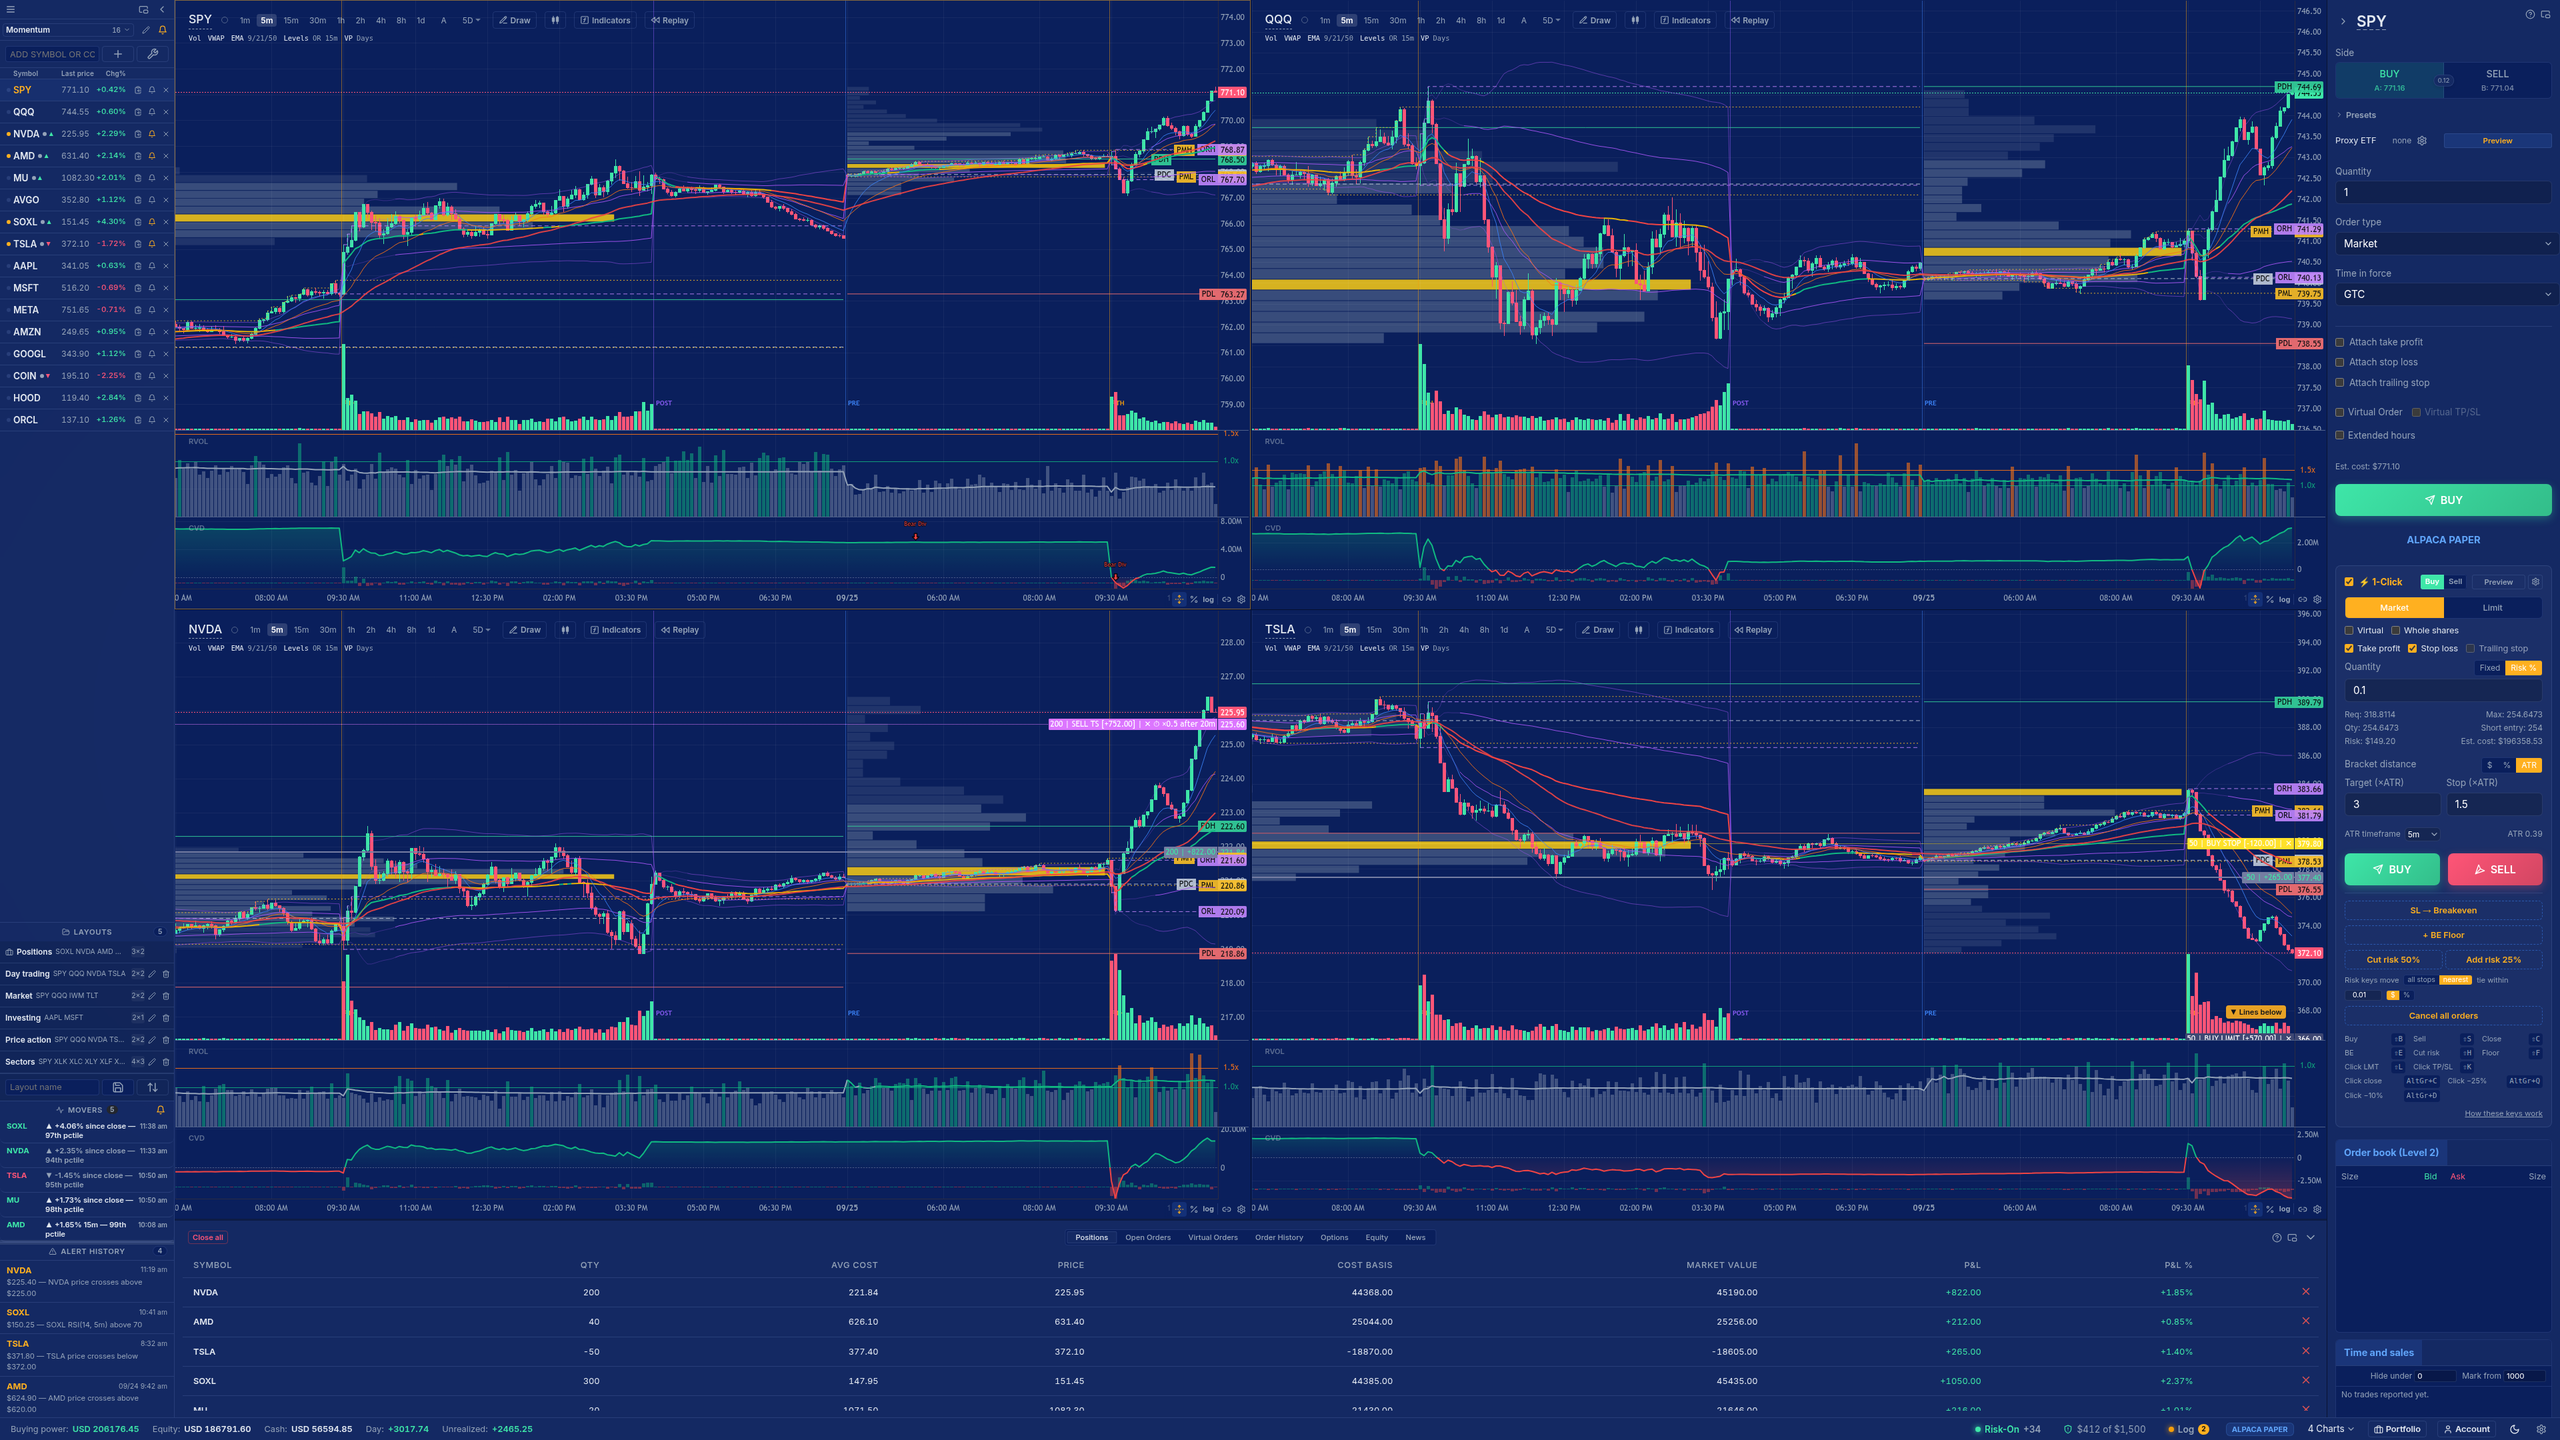
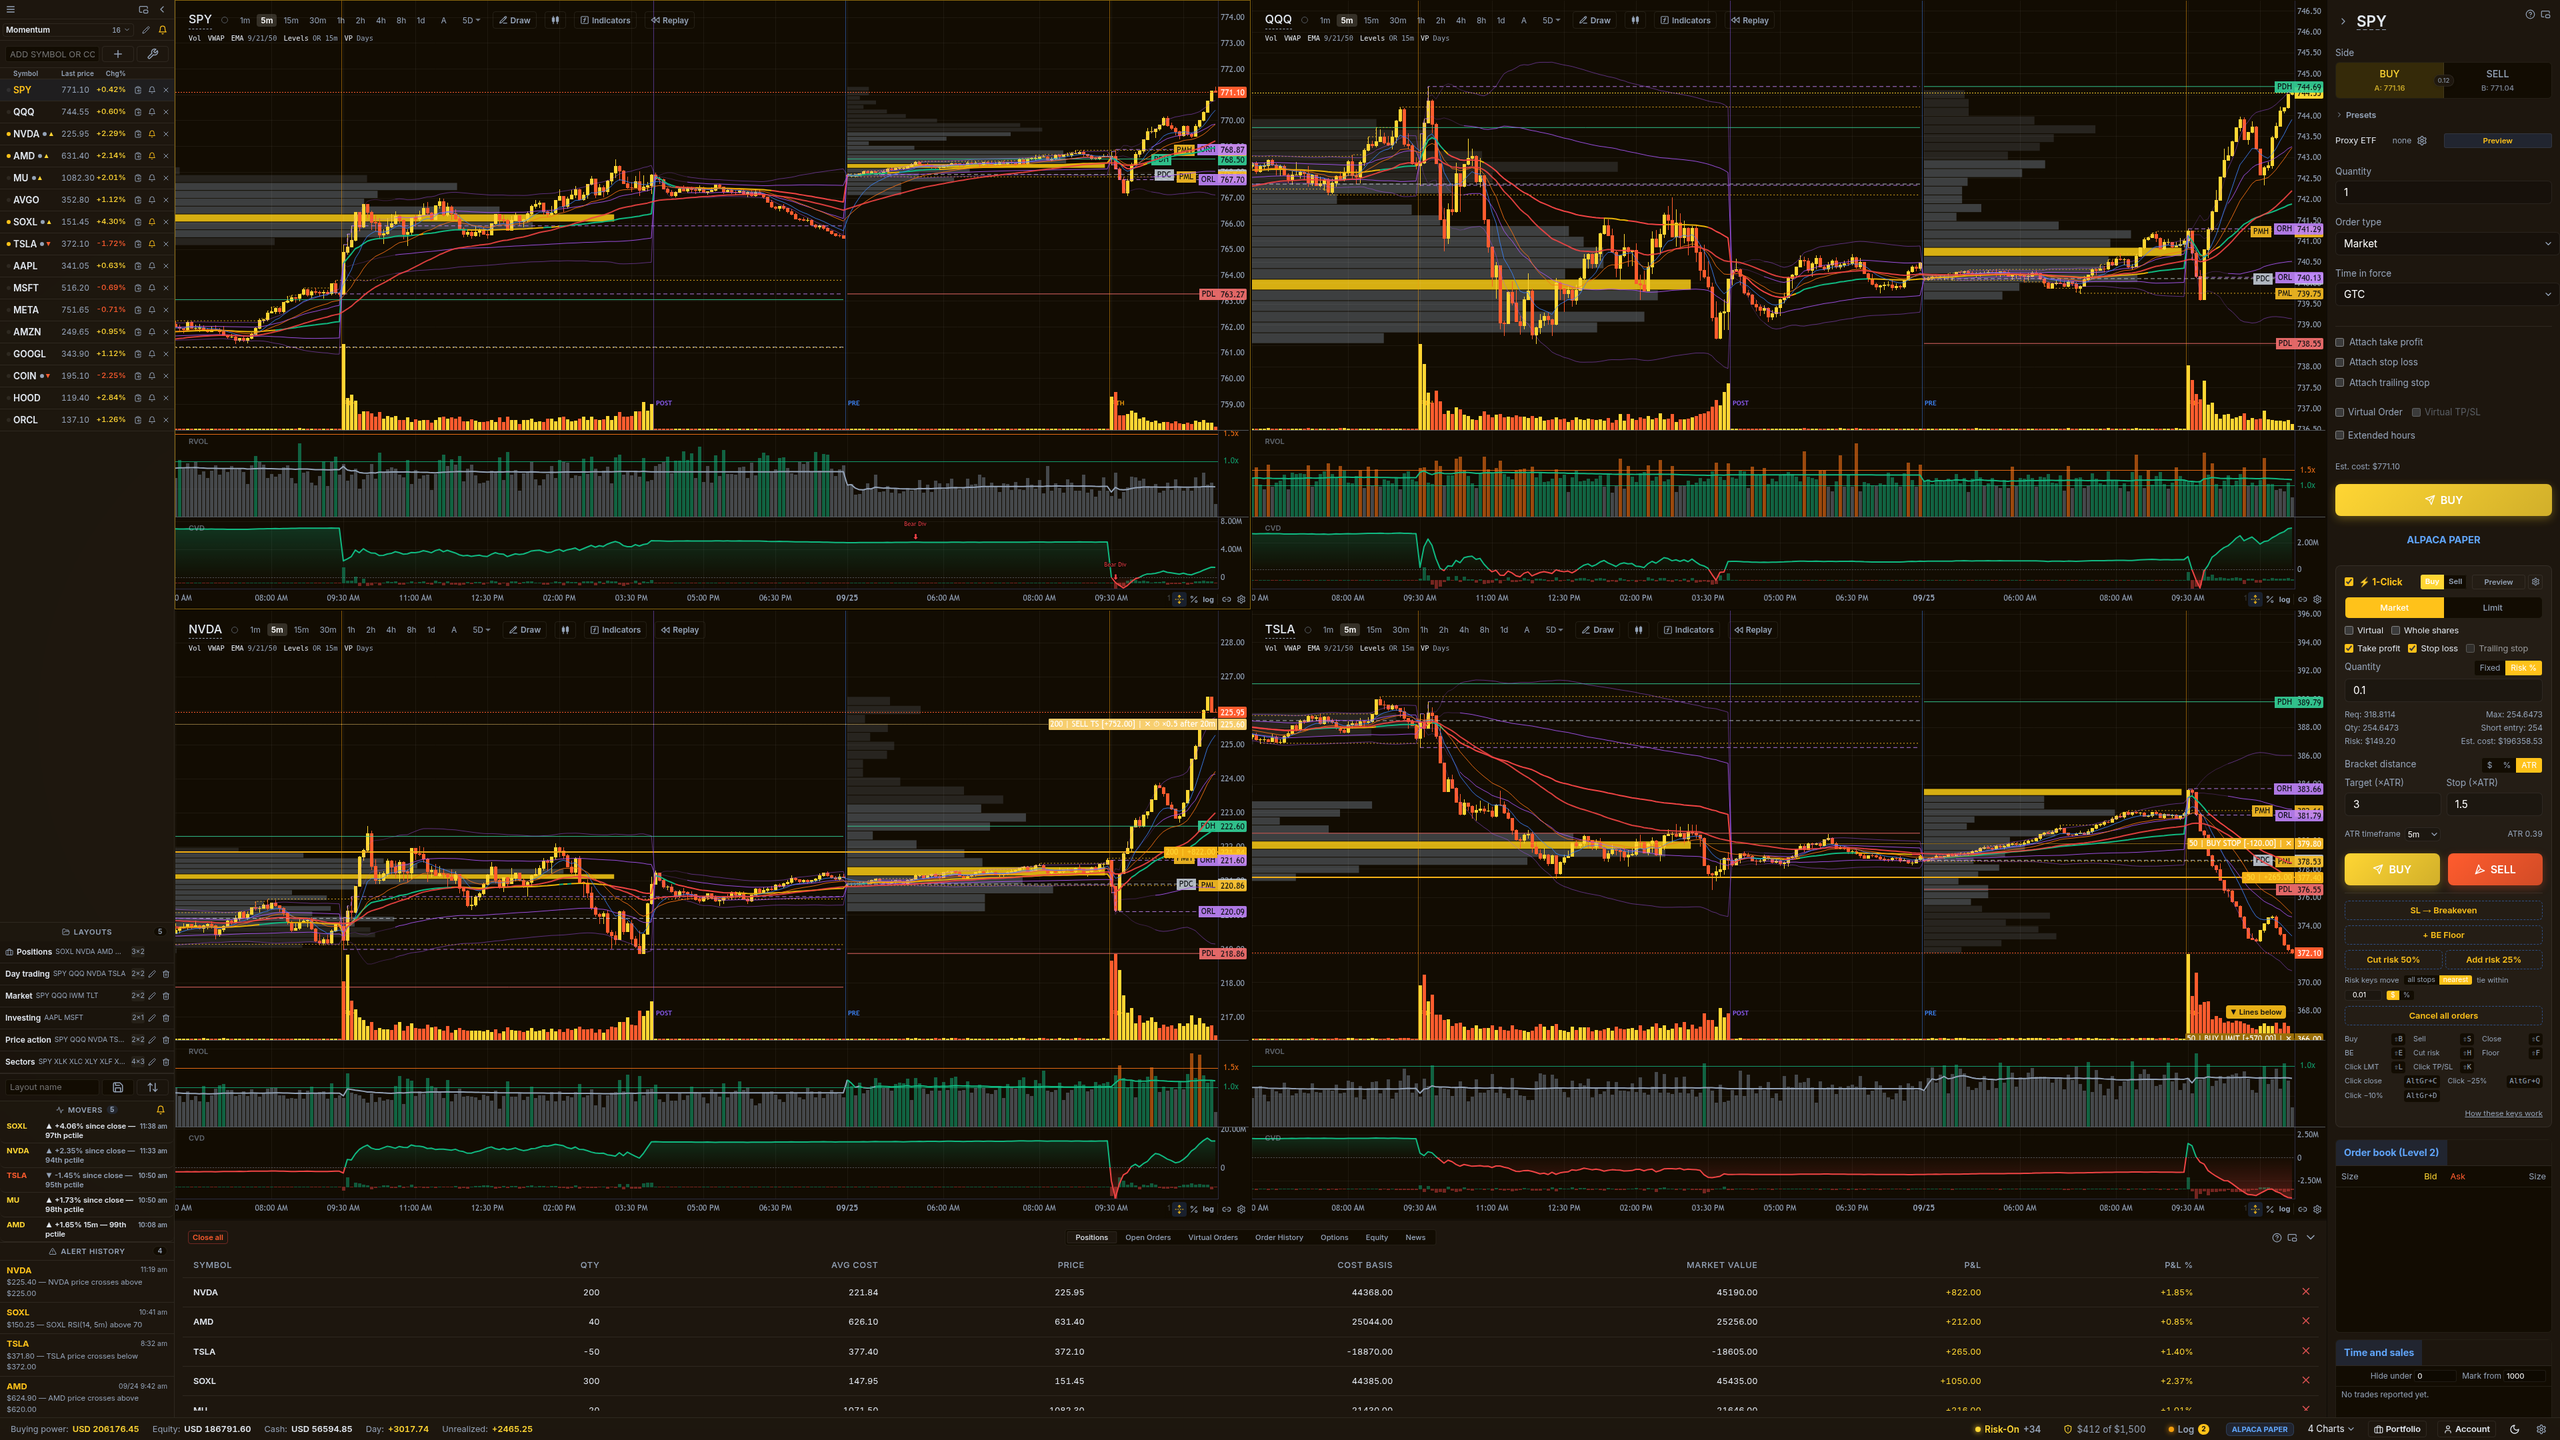
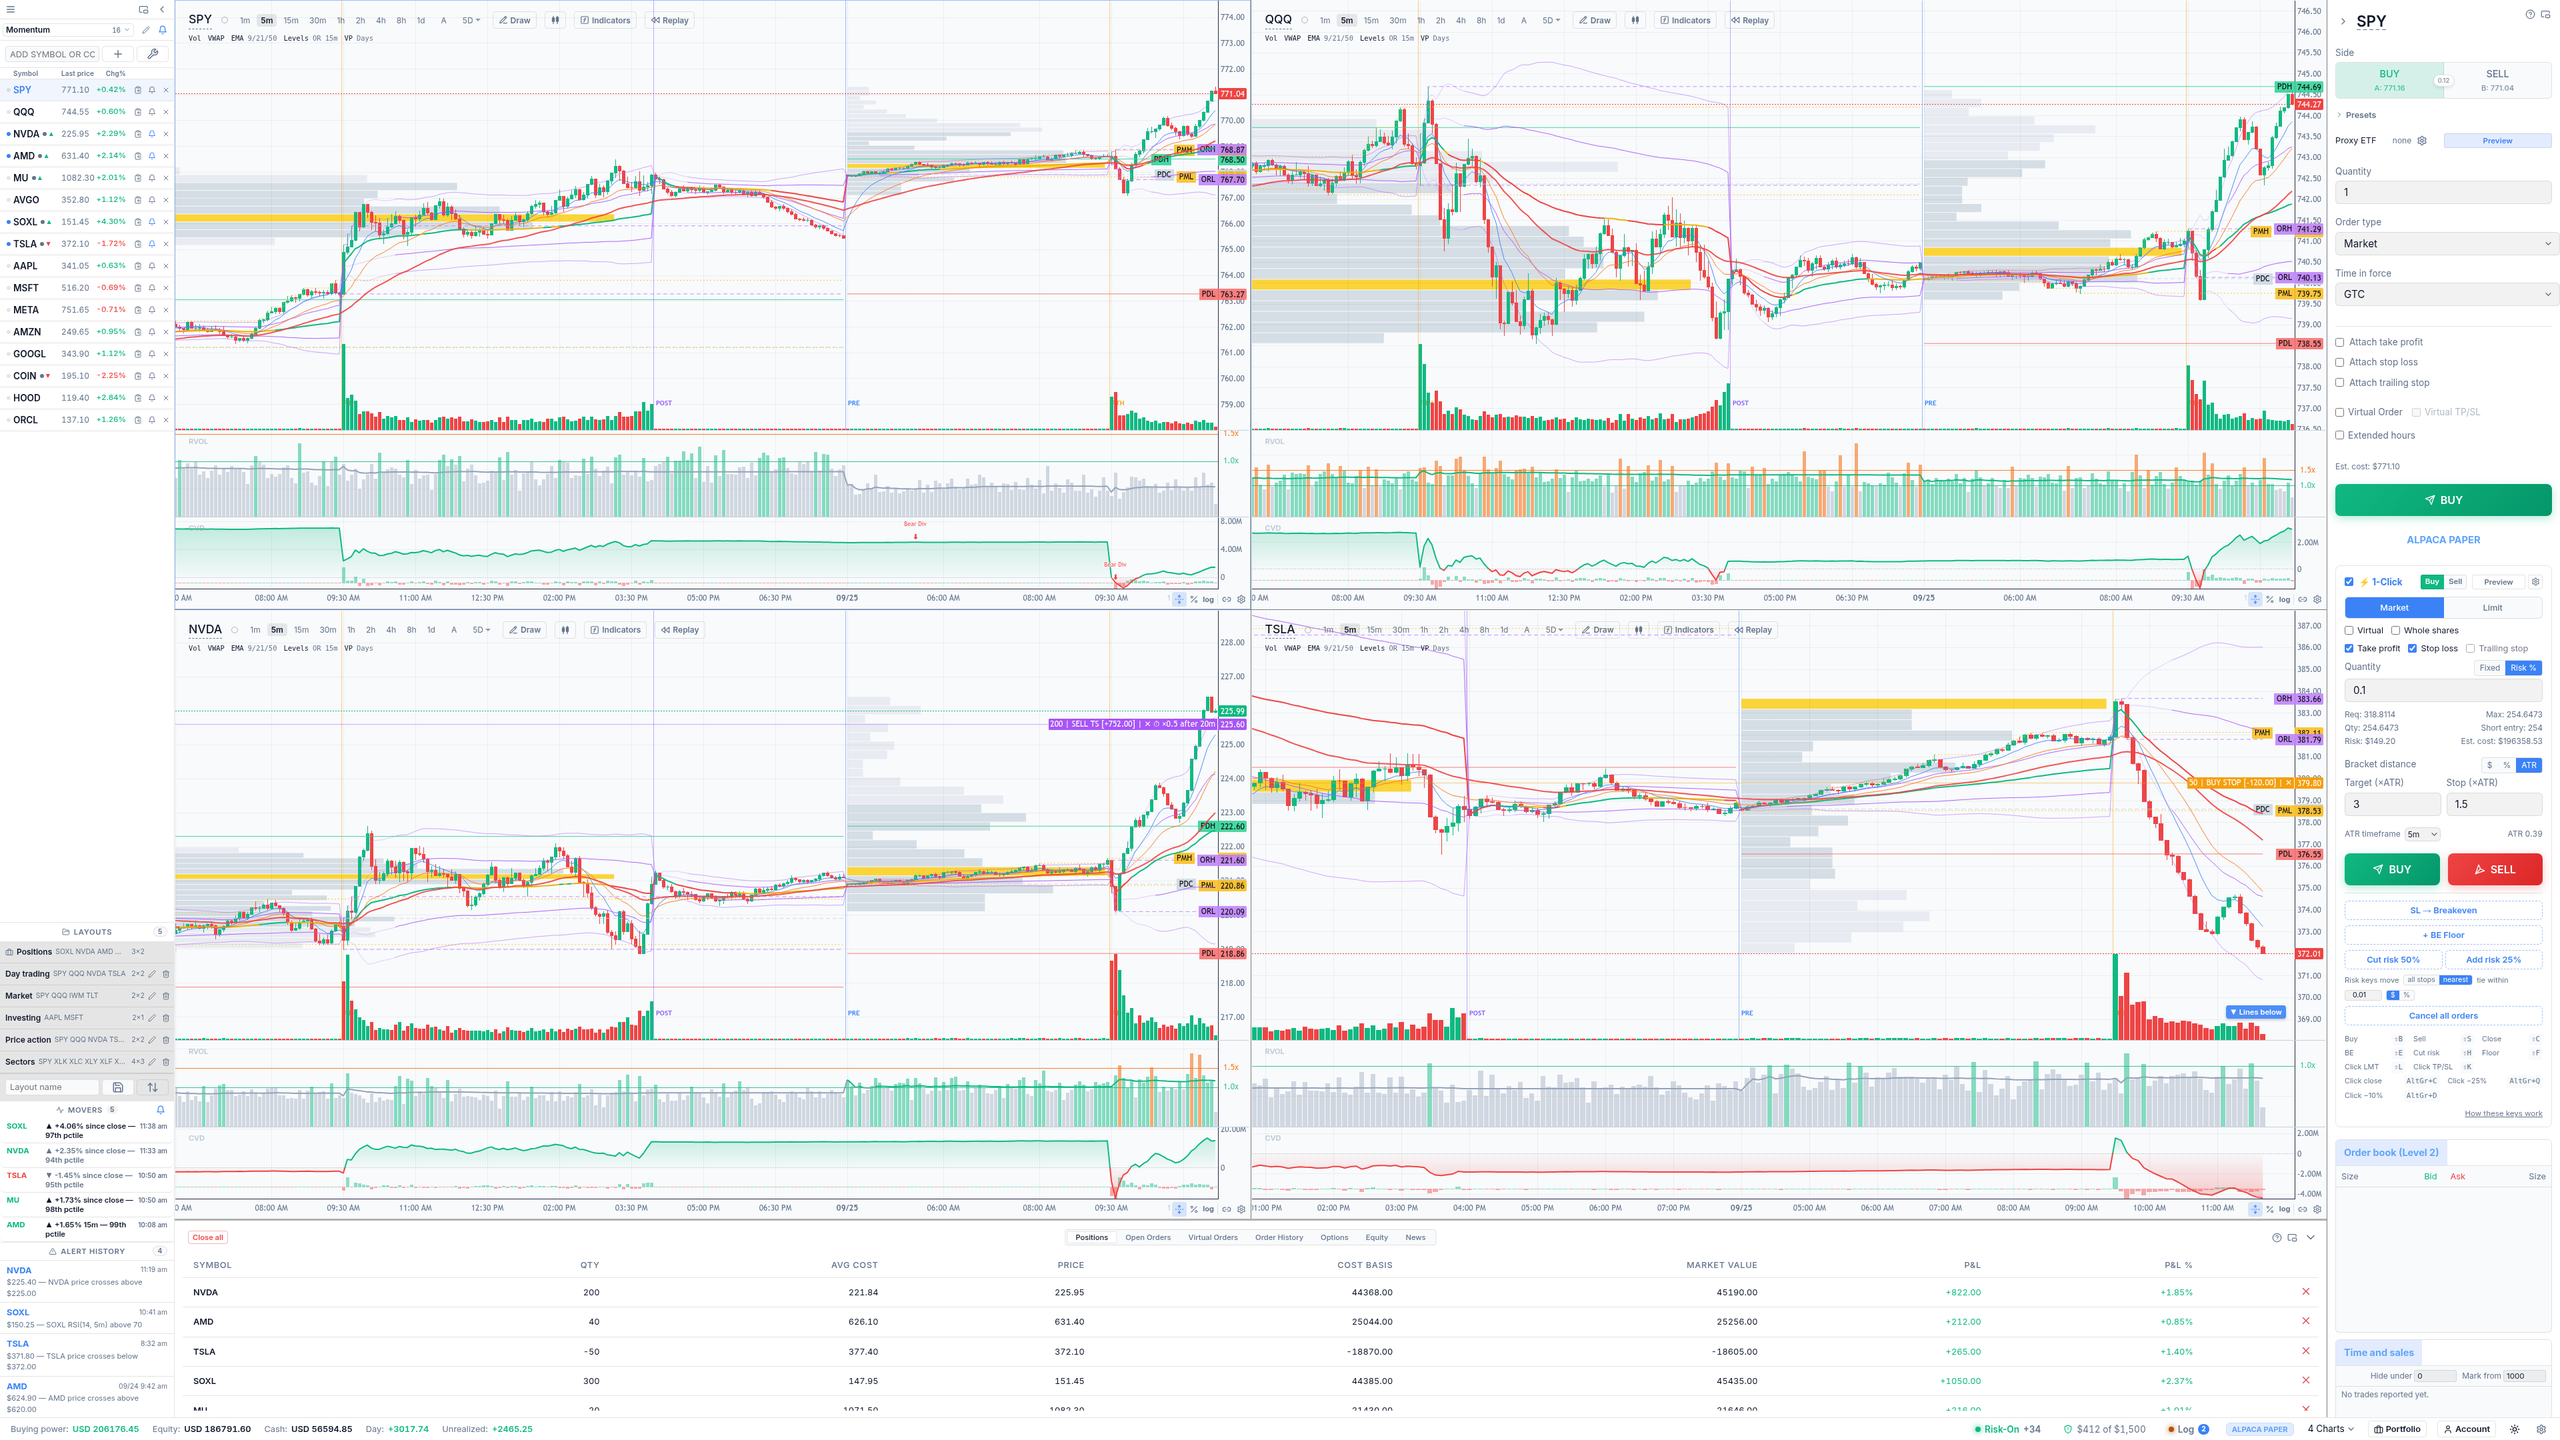
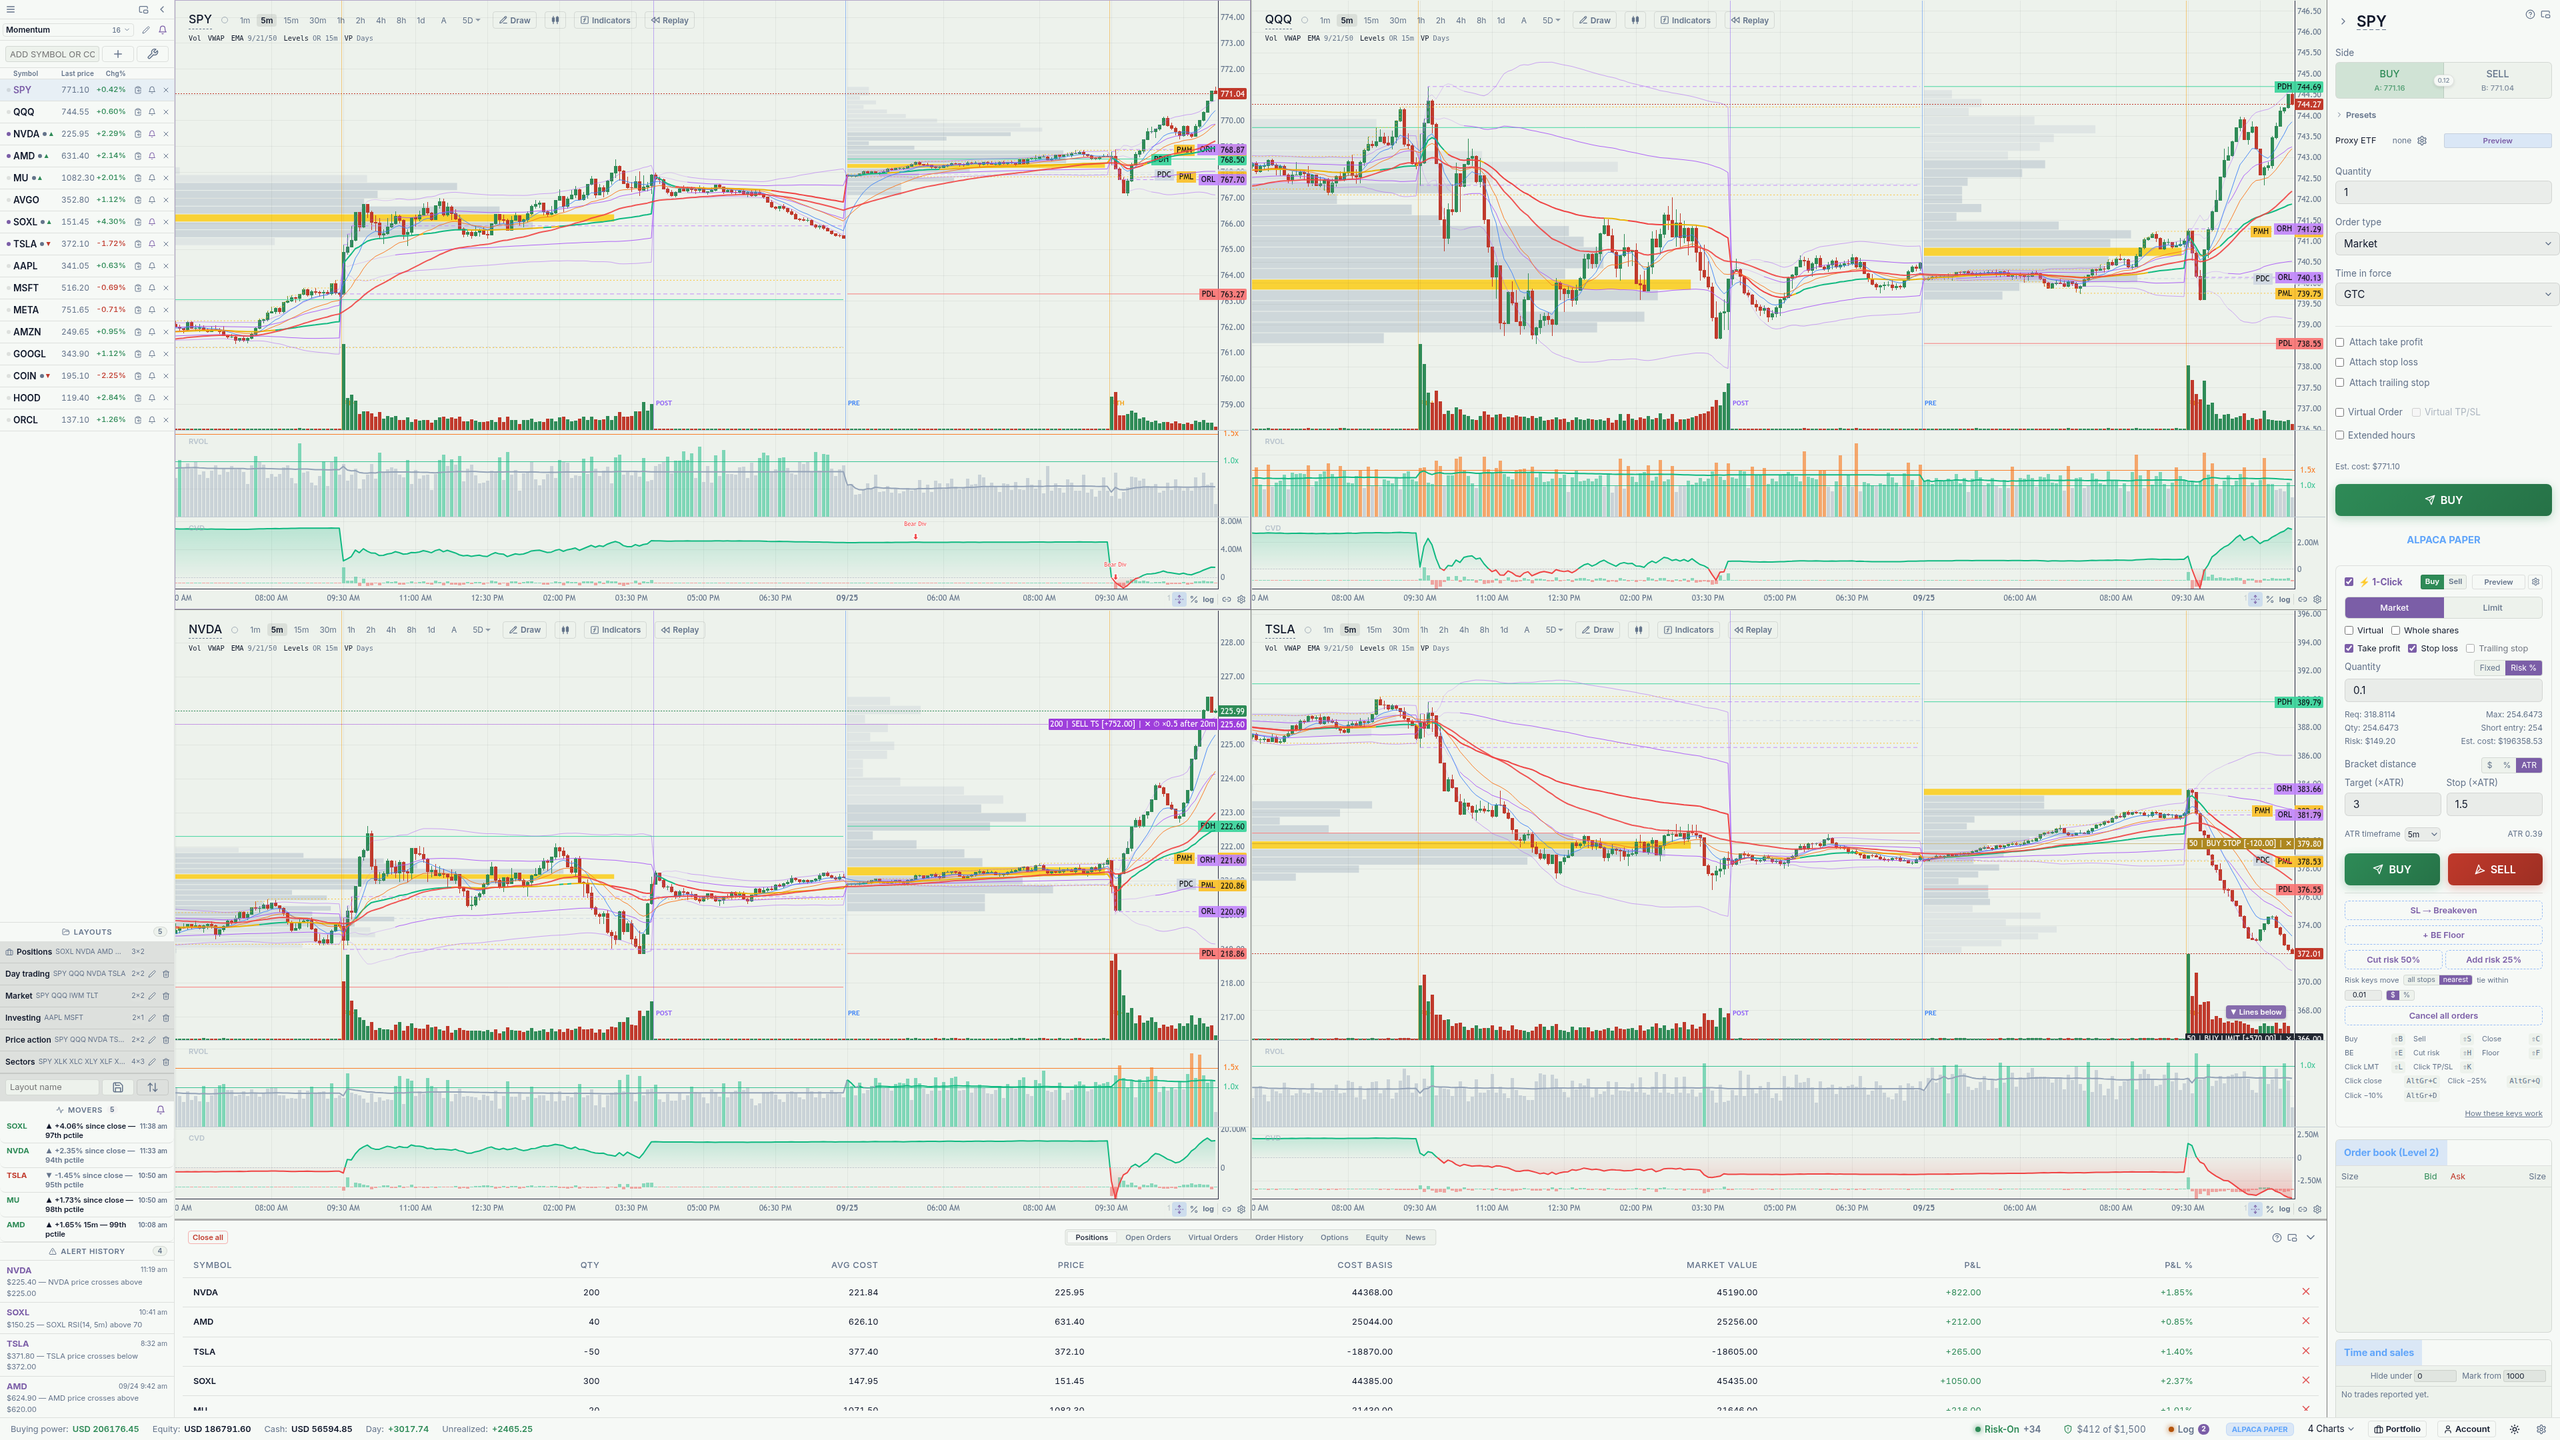
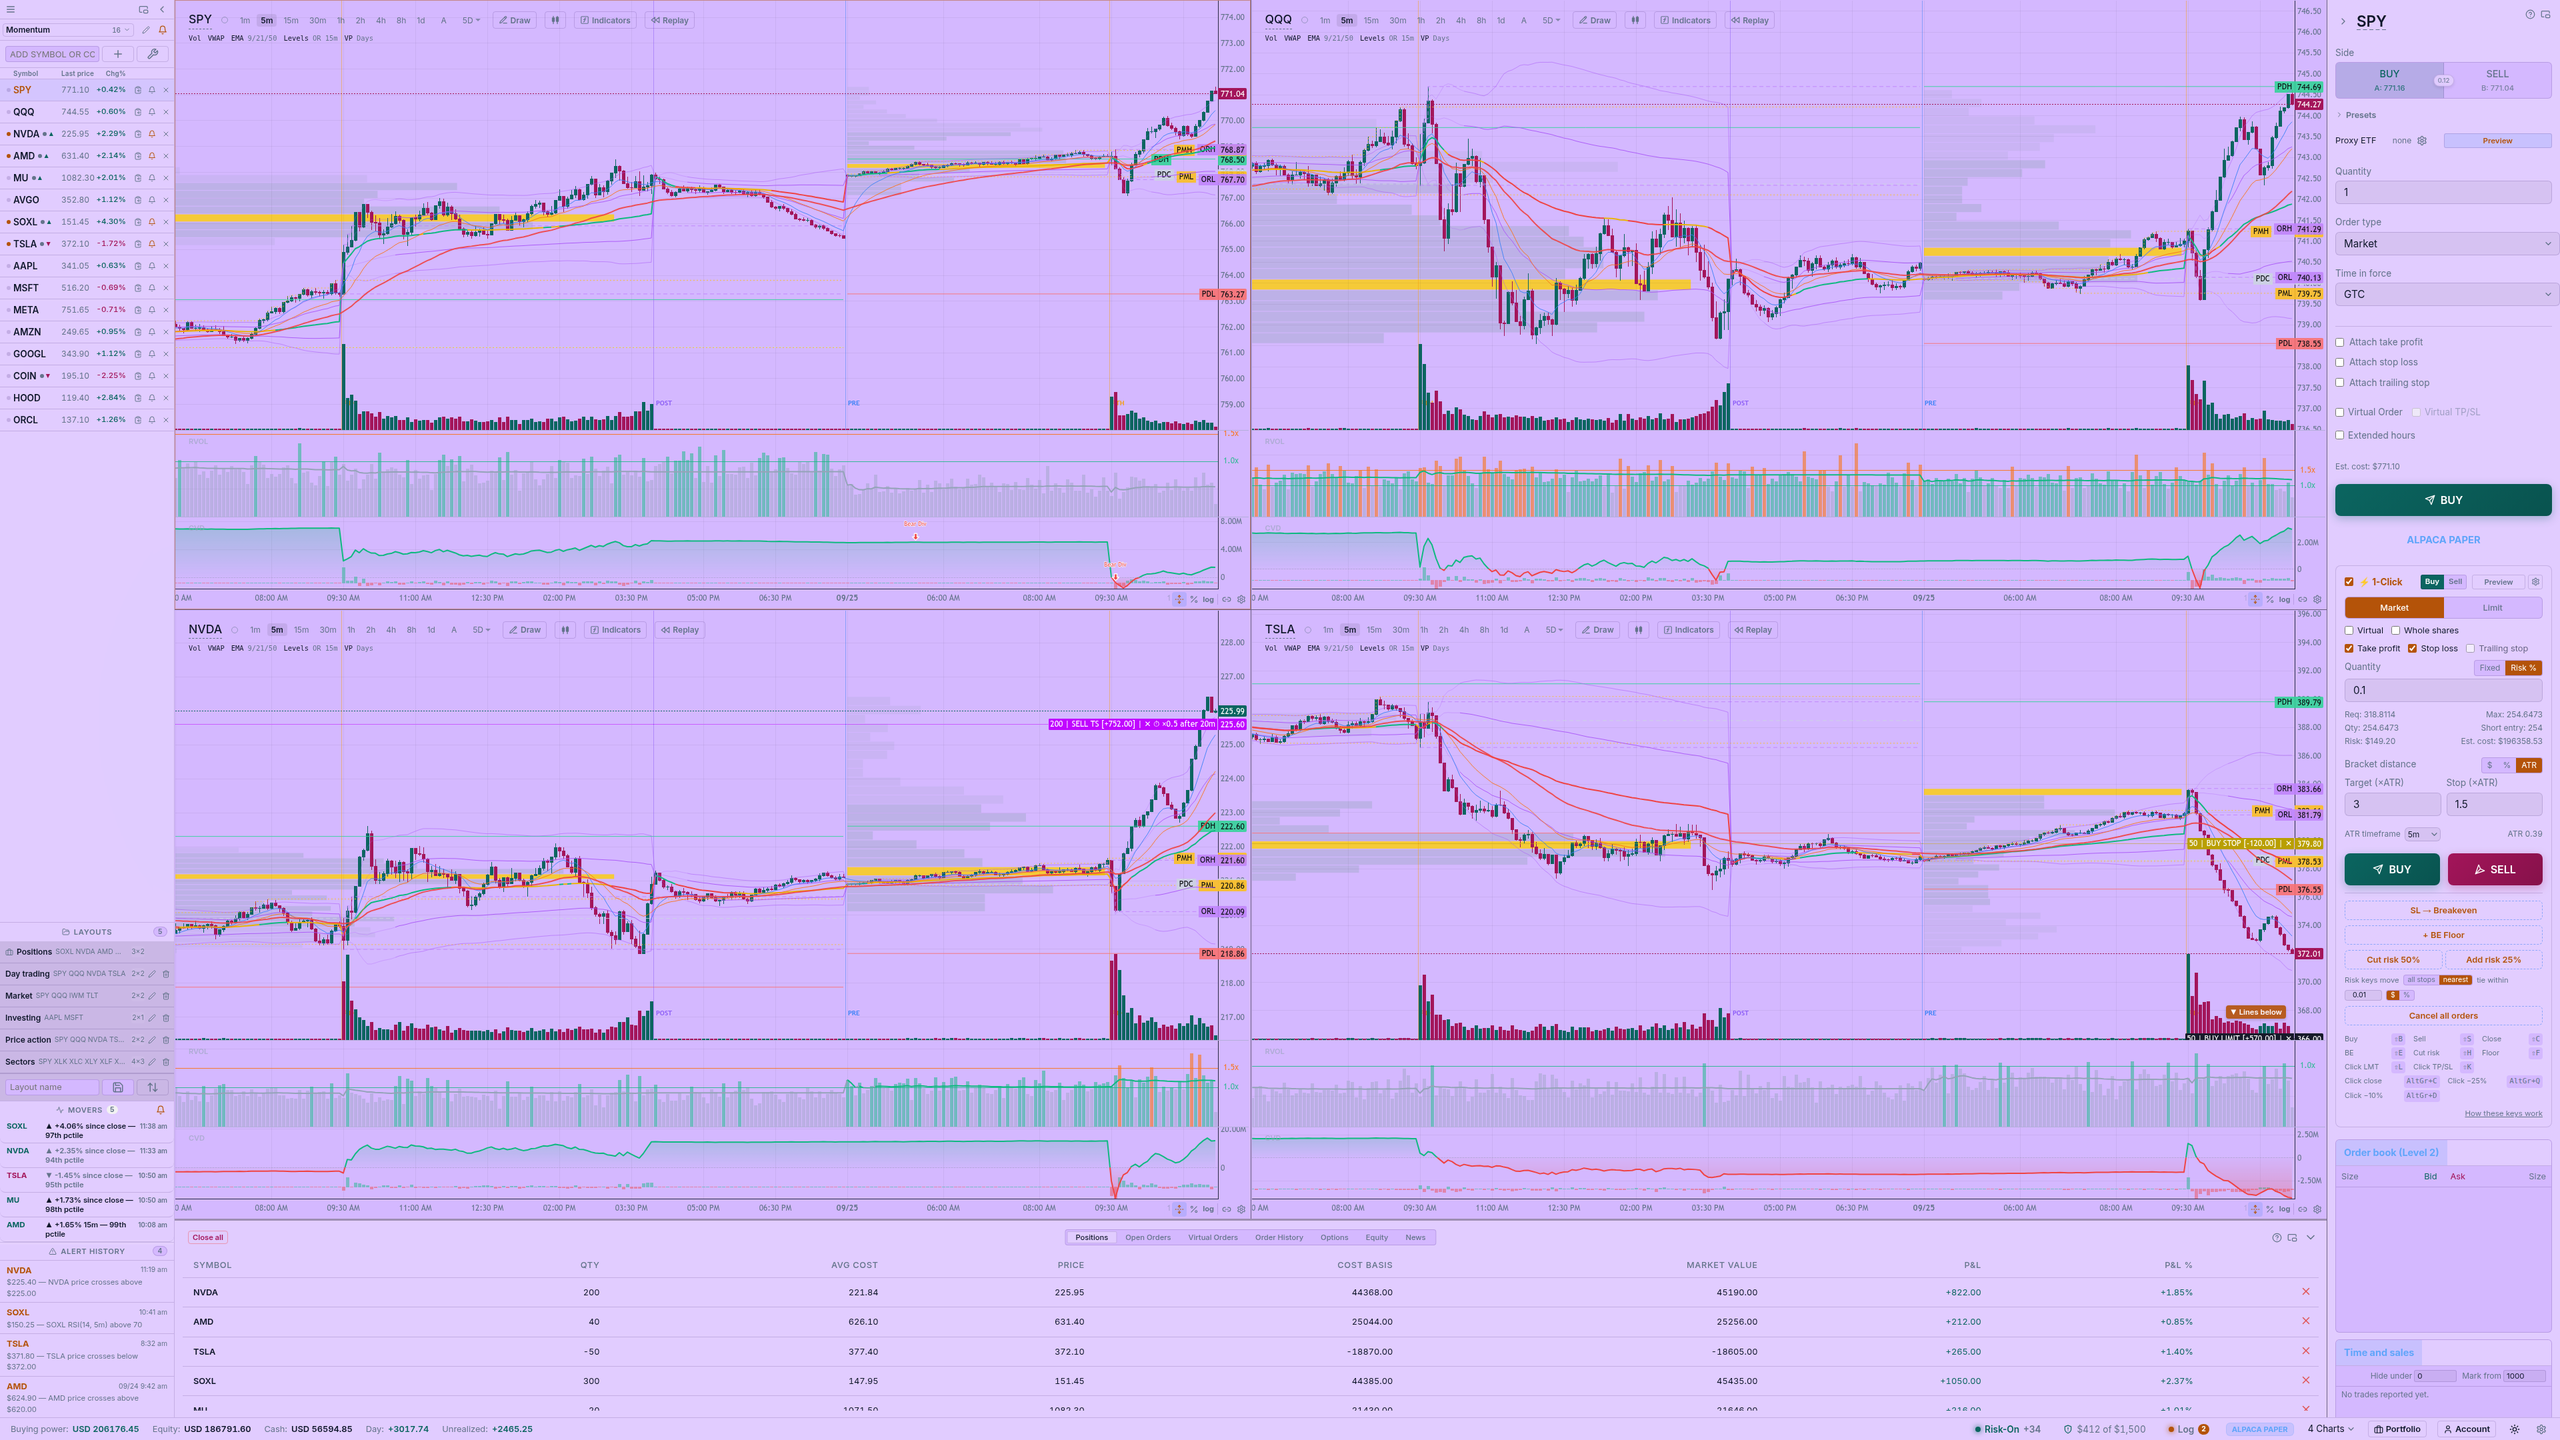
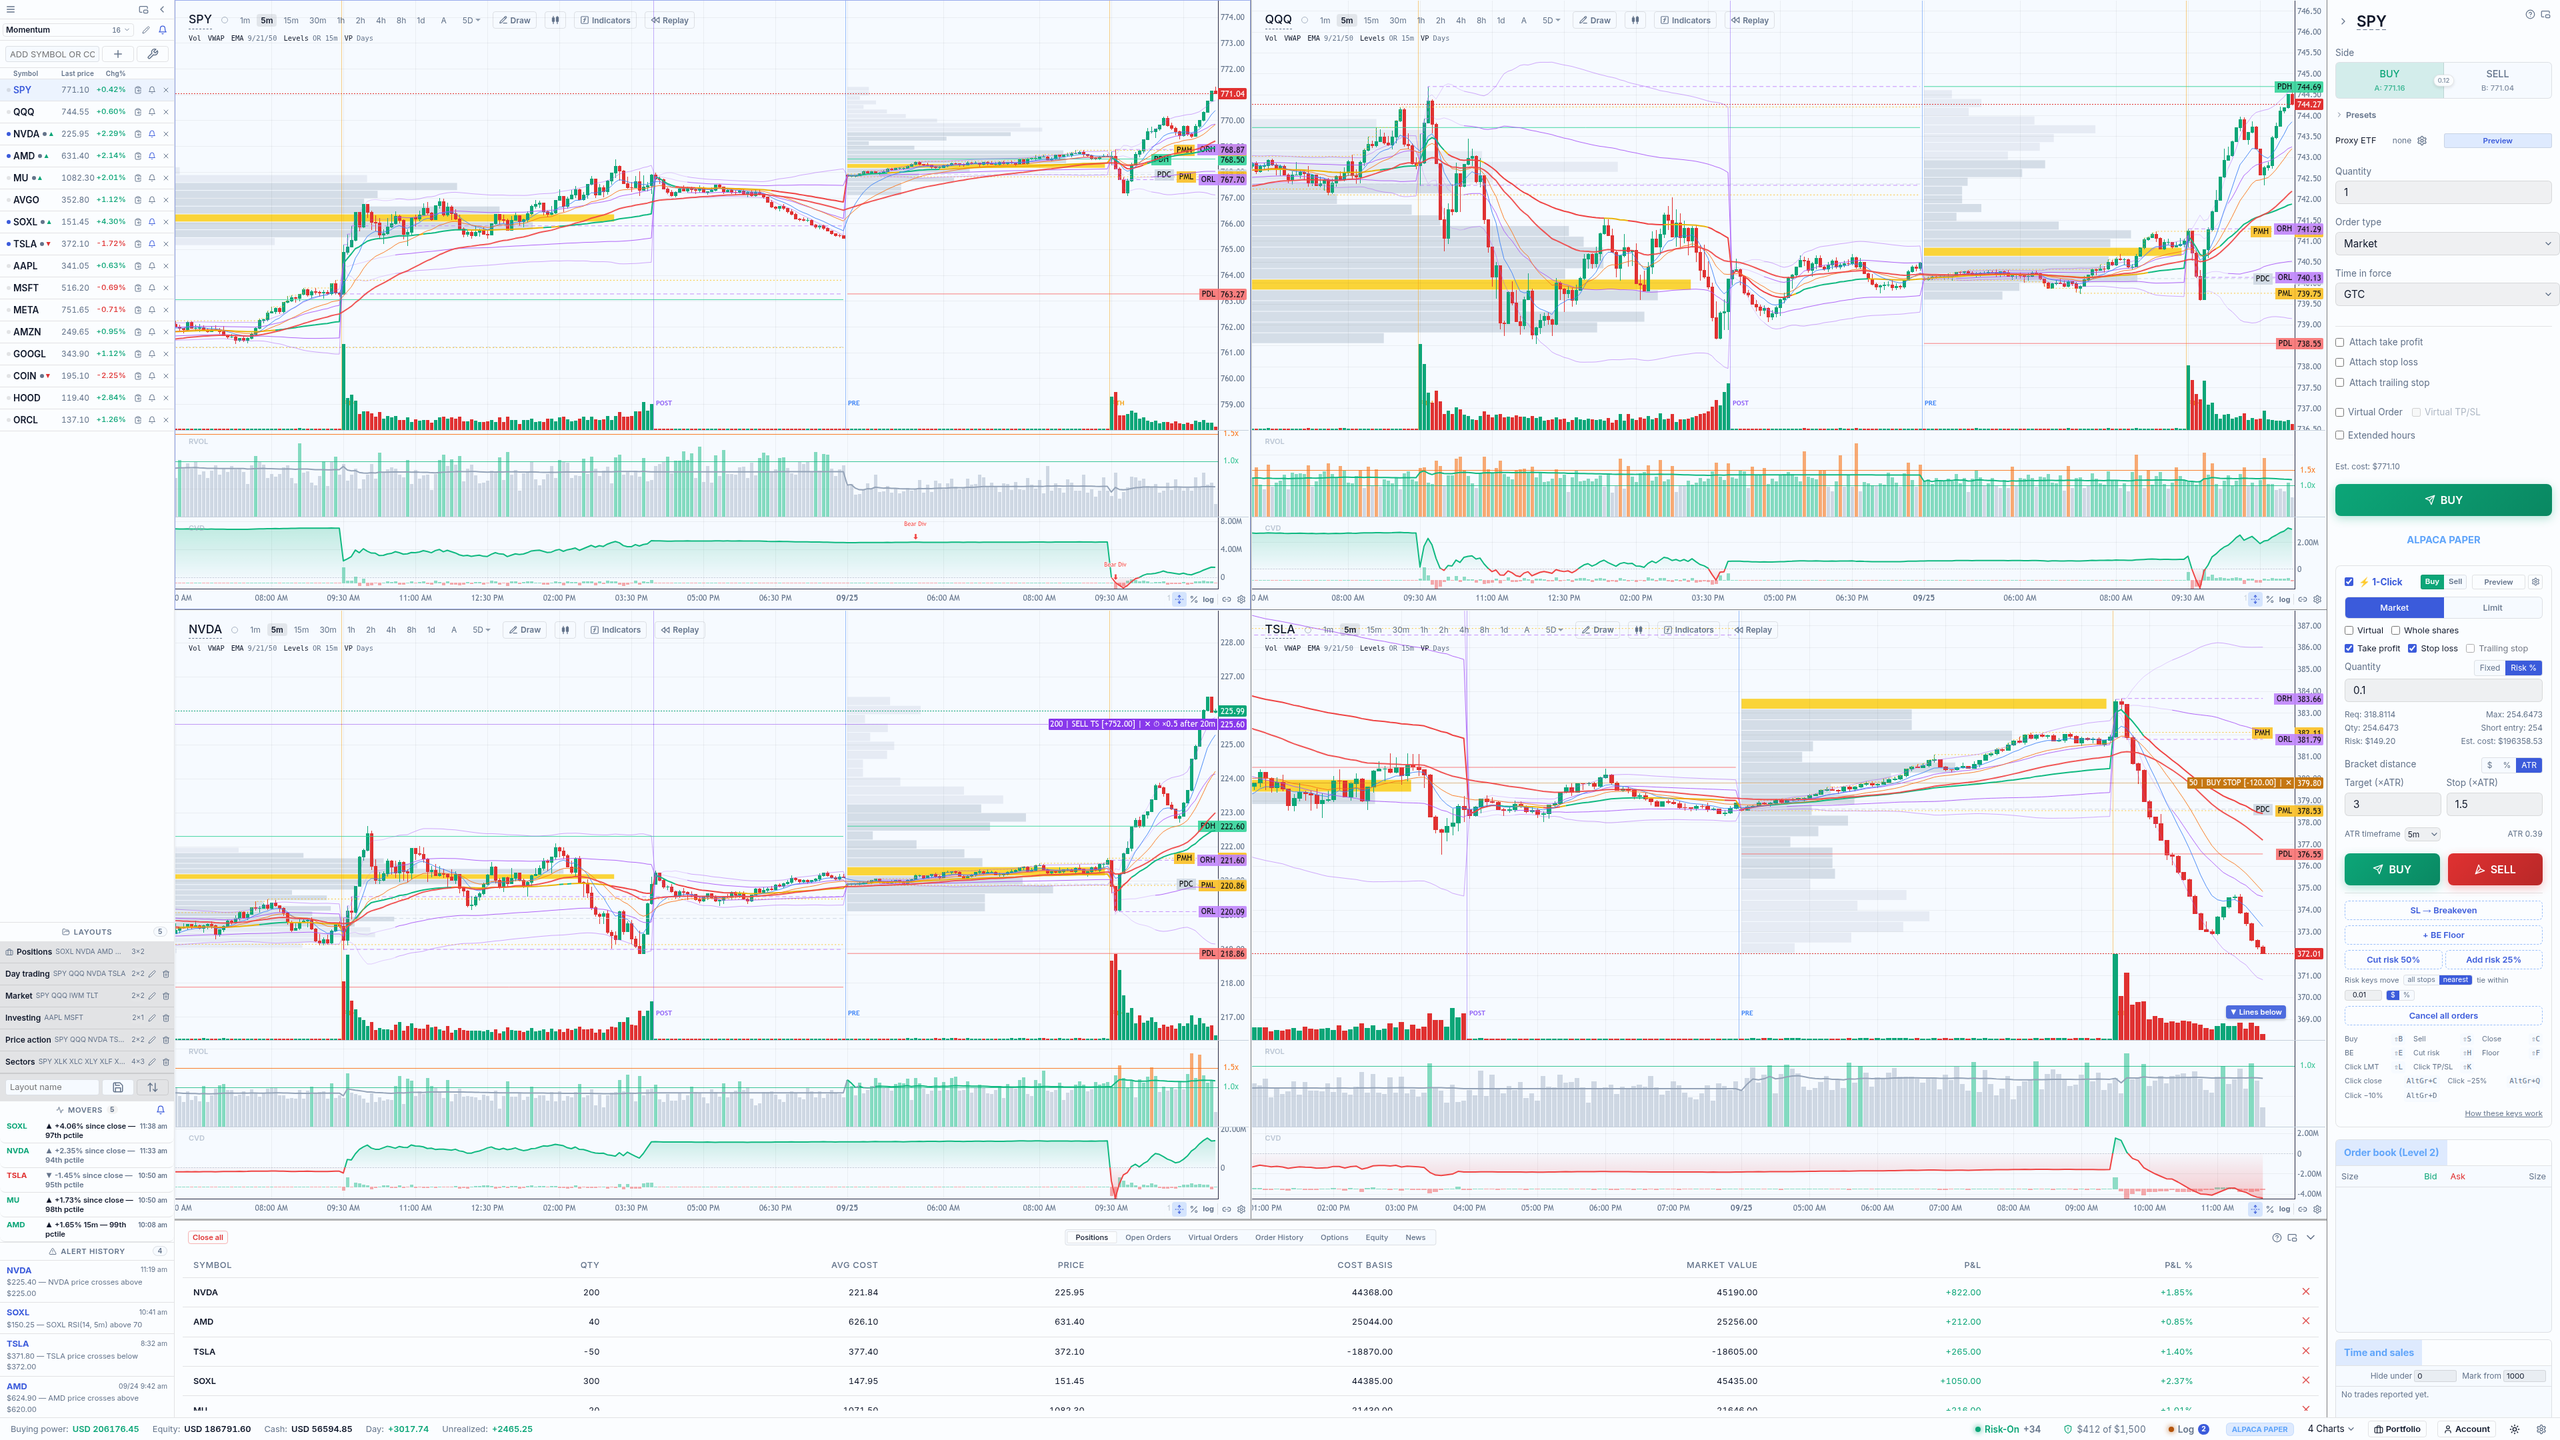
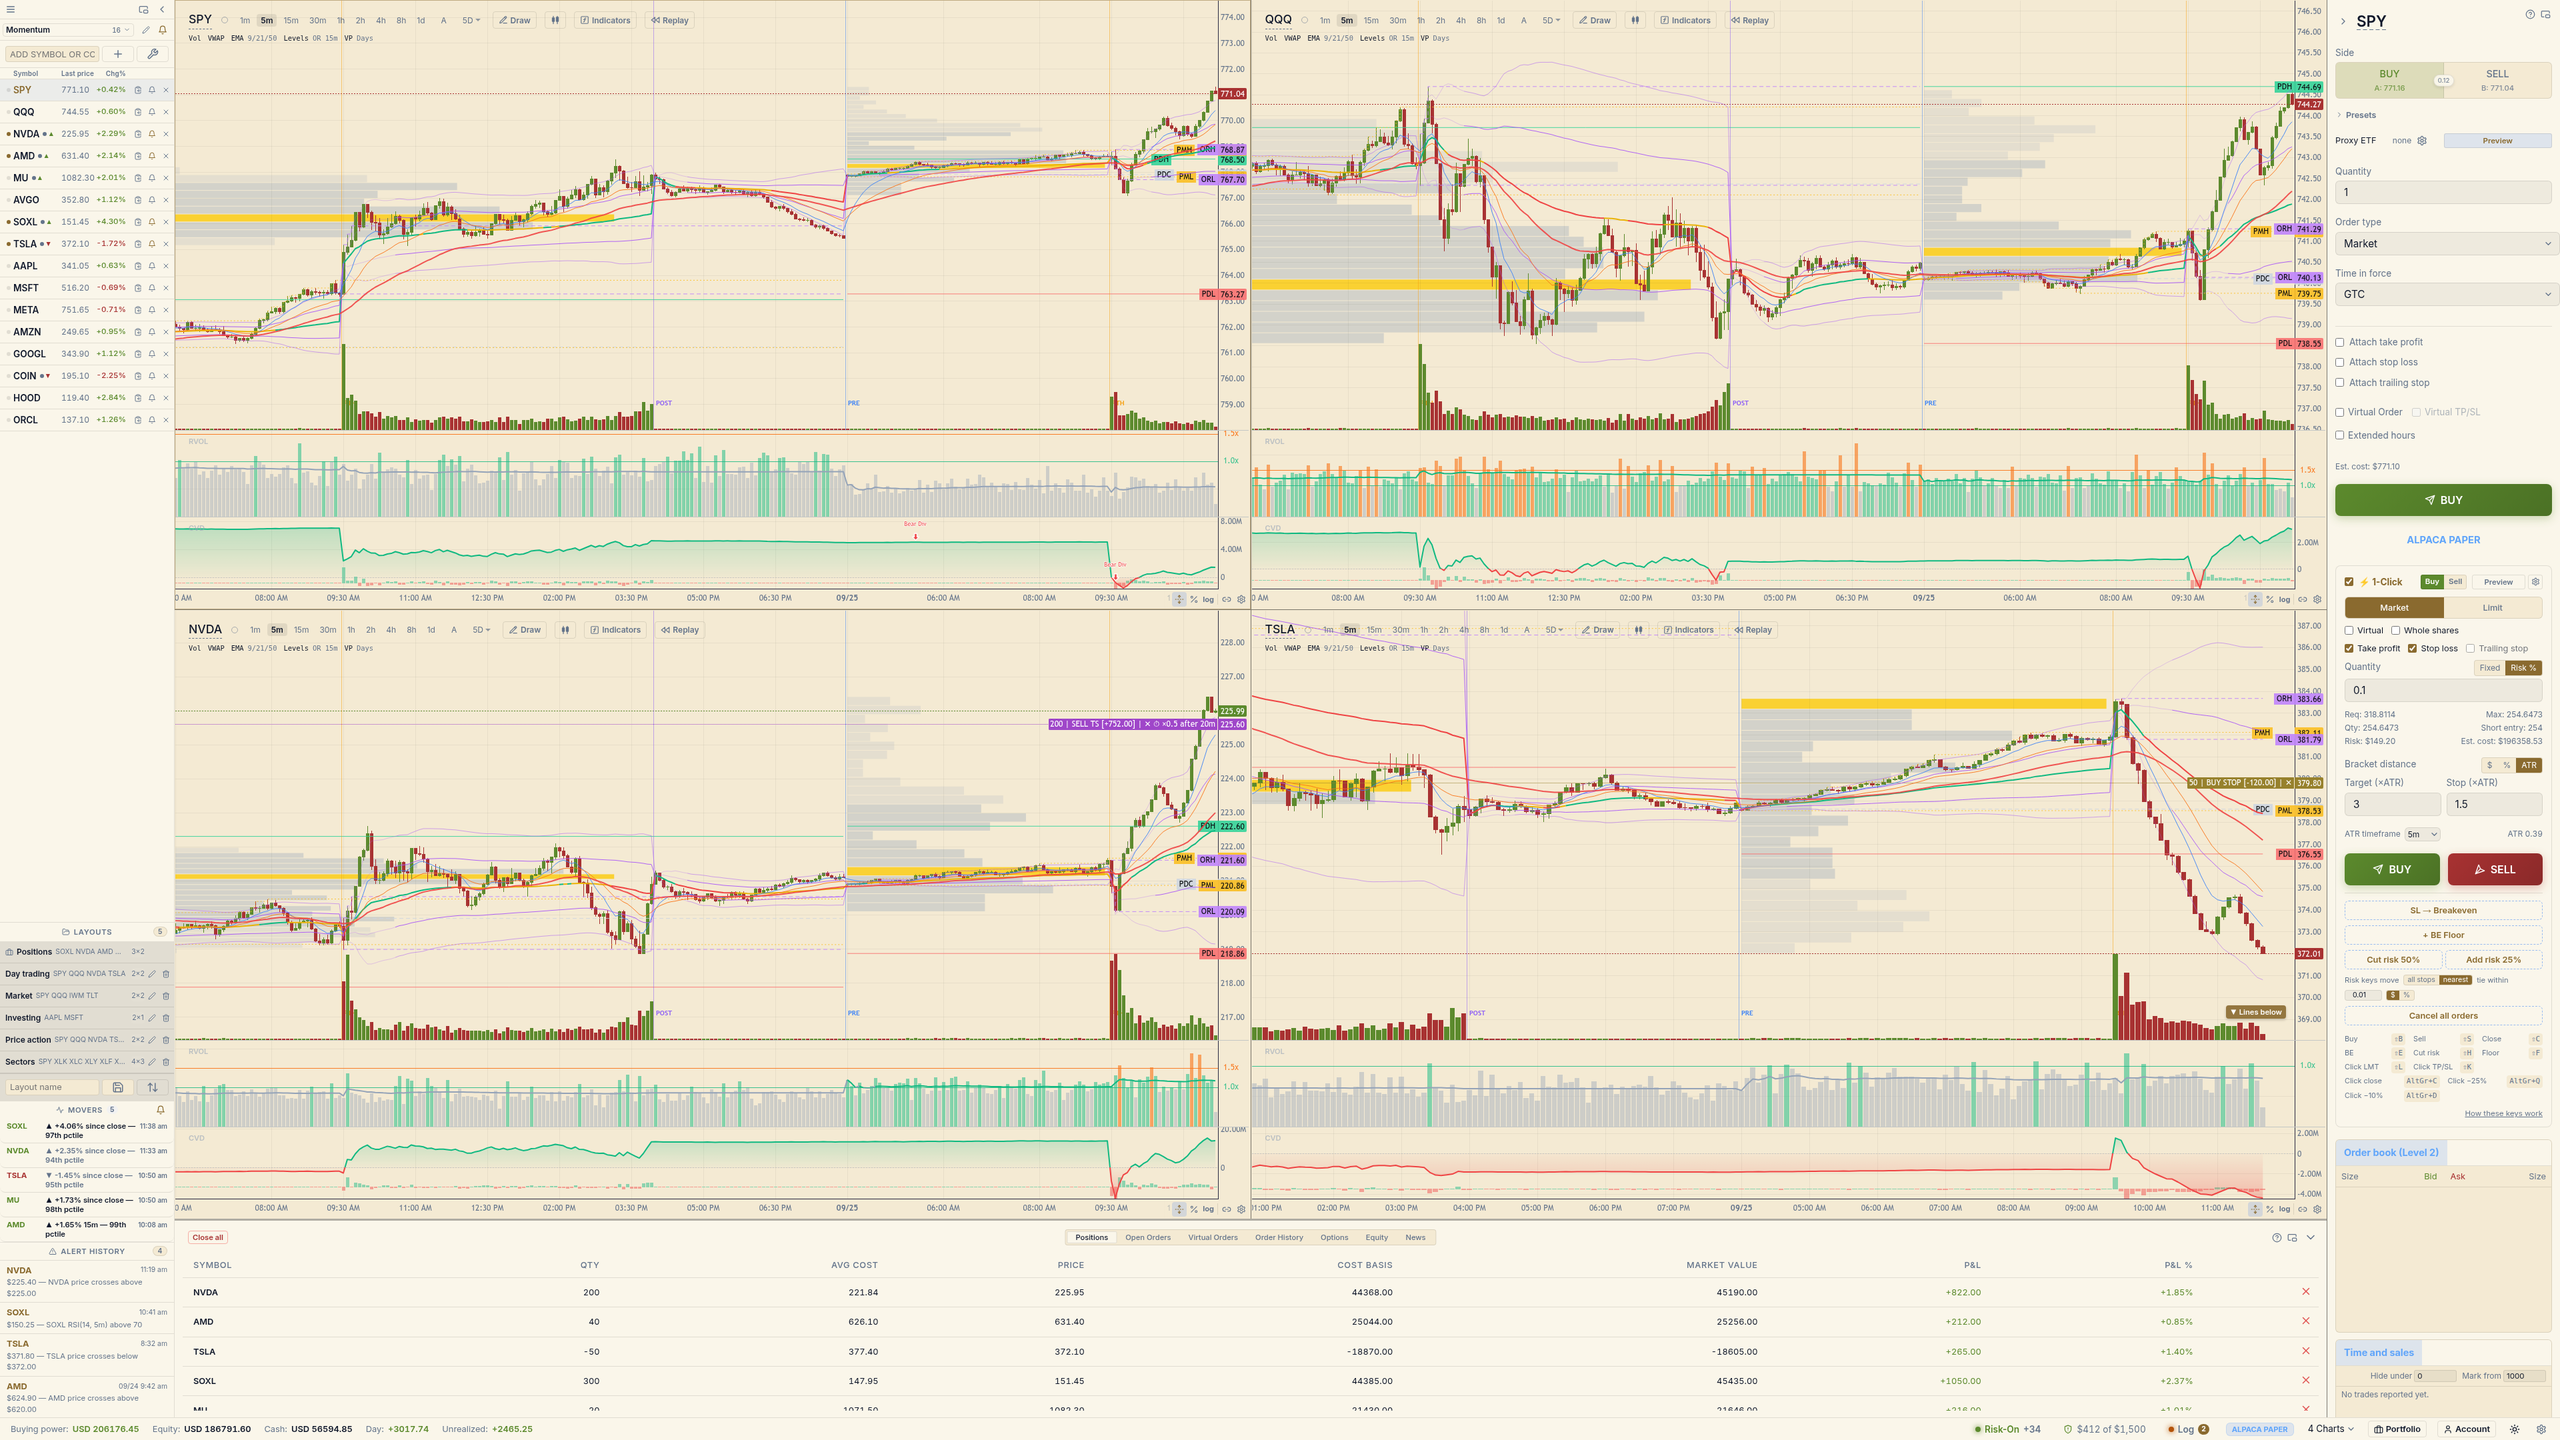
Choose a light, dark or system theme from the status bar. Select a palette name for a preview.
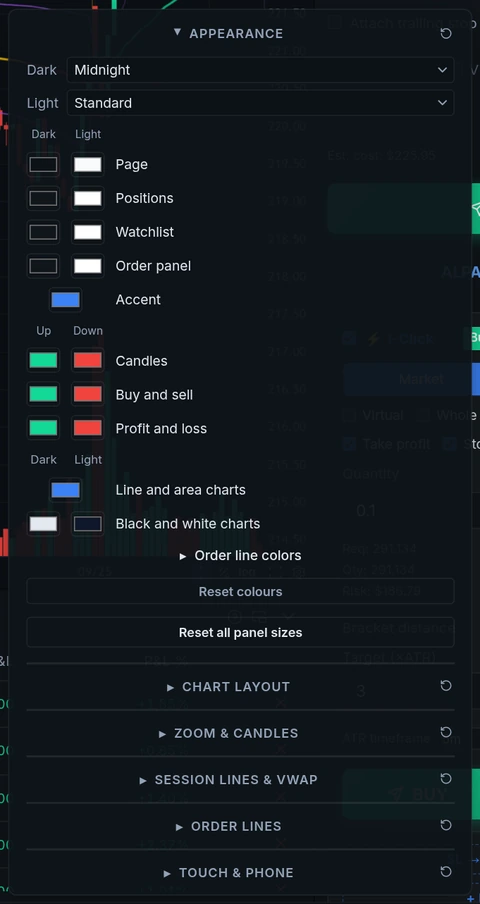
Customize page and panel colors, the accent color, candles, buy and sell, and profit and loss. Reset a palette to its original colors at any time.
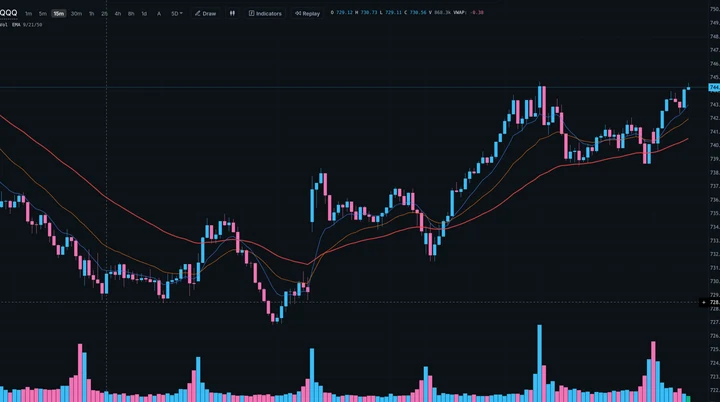
Set rising and falling candle colors and the accent color for every chart.
Set chart types and indicators separately for each chart in a grid. Save a full setup as a template.
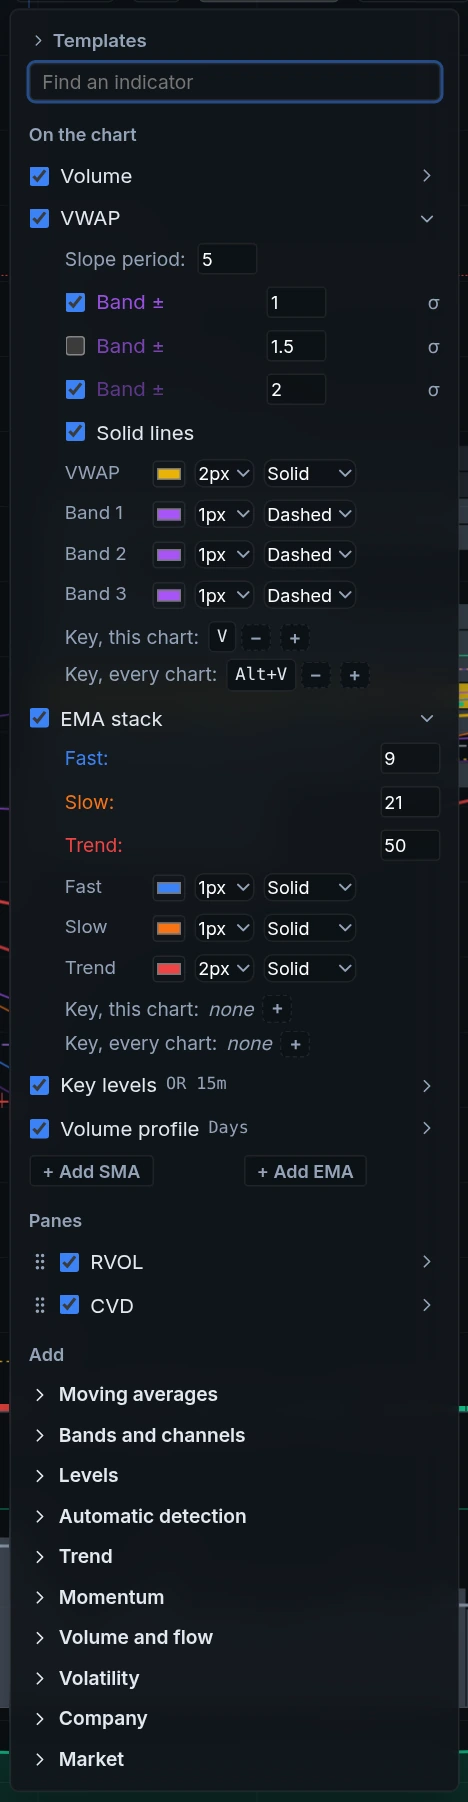
Use the Indicators menu to set the color, width and dash of each indicator line, including VWAP bands, moving averages and pane studies.
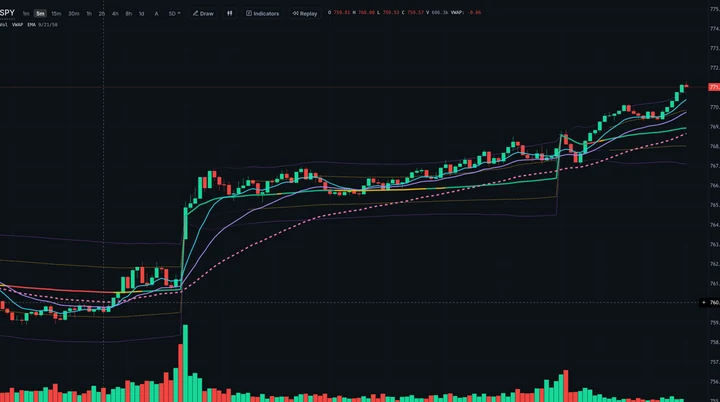
Customize every indicator line independently, including VWAP, its bands and moving averages.
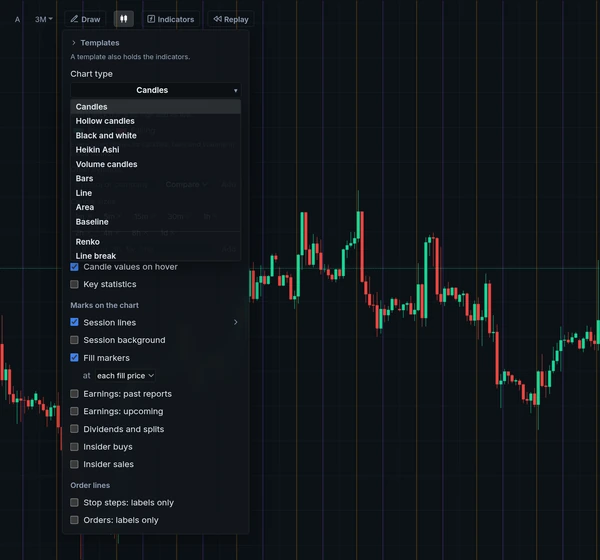
Choose a chart type from the Chart button, then configure axes, grid lines, session lines and candle sizes from the chart settings. Every type is on the charts page.
Open the Draw menu at the top of a chart to place trendlines, channels, Fibonacci and Gann tools, shapes, notes, Elliott counts, position plans and volume tools. Drawings appear on every chart of the same symbol and stay aligned with the price action when the candle size changes.
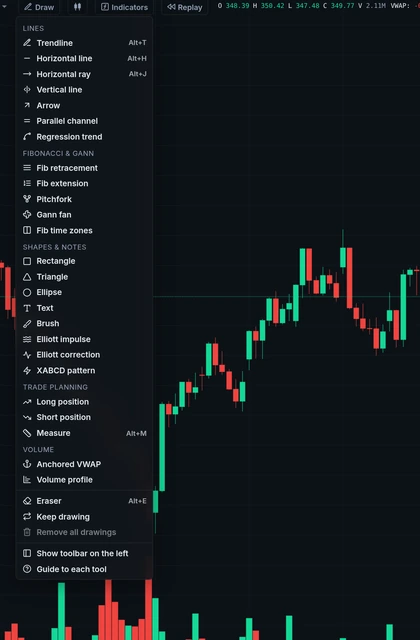
The Draw menu lists every tool in five groups: lines, Fibonacci and Gann, shapes and notes, trade planning, and volume. Some tools have shortcut keys. The same tools can sit in a column down the left of the chart, and Keep drawing leaves a tool armed for several drawings in a row.
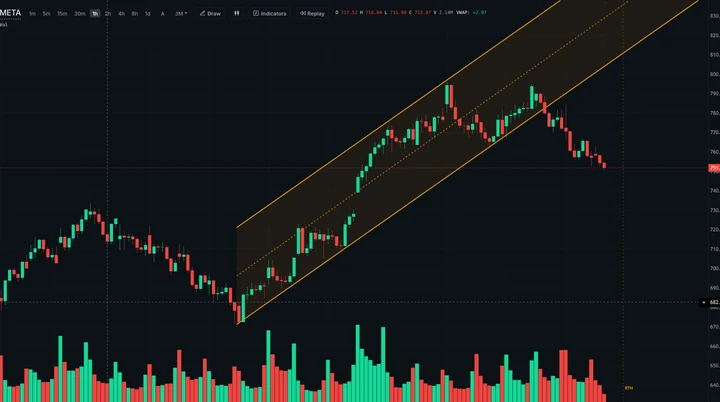
Click two points for the base line and a third for the width, then extend either line to the right or left. Trendlines, horizontal lines and rays, vertical lines, arrows and a regression trend are in the same group, and a line can carry an alert.
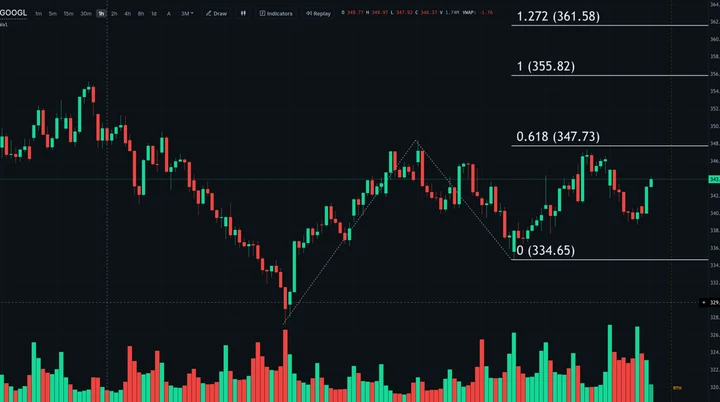
For an extension, click the start and end of a swing, then where the next move starts: the levels 0.618, 1, 1.272, 1.618 and more are drawn from there, each with a price. Retracements, pitchforks, Gann fans and time zones are in the same group, and the levels can be changed.
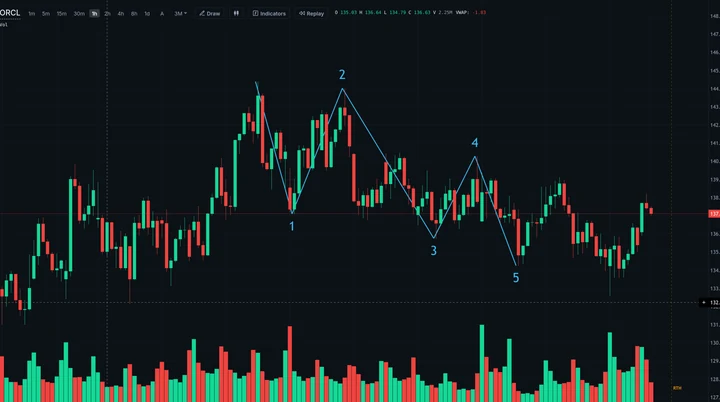
Click the origin and the end of each wave to mark a five-wave count, numbered 1 to 5 on the chart. A three-wave correction and an XABCD pattern, which shows the ratio of each leg to the one before, are separate tools.
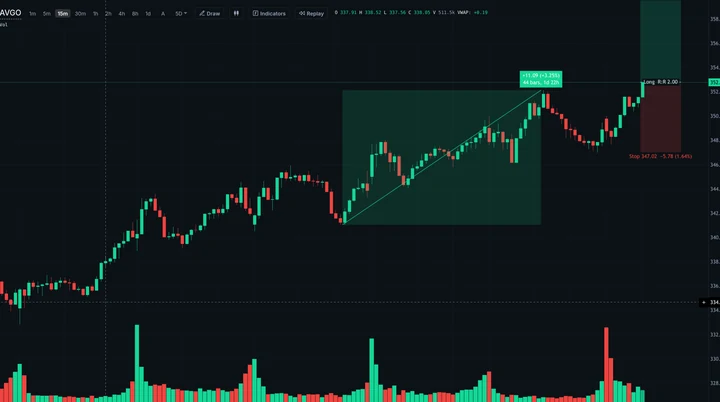
Click an entry price for a long or short plan, then drag the stop and target. The zones show the distance to each and the reward-to-risk ratio. Send to ticket fills the order ticket with the plan’s levels without placing an order. Measure shows the change in price, percent, bars and time between two points.
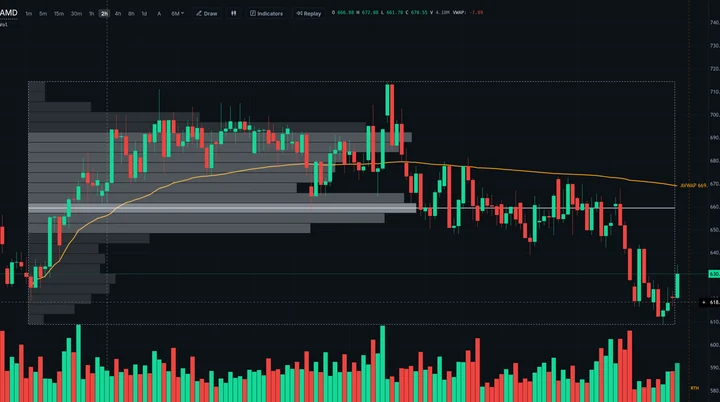
Click a bar to start a VWAP from it instead of from the session’s open. Click two points to see the volume traded at each price between them, with the busiest price and the band holding 70% of the volume marked.
Customize shortcuts for Workspace, charts, one-key trading and replay.
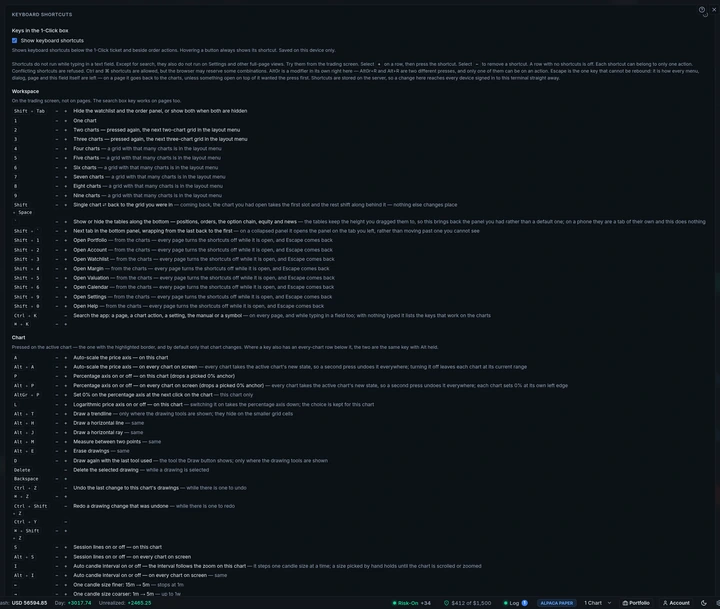
Assign any action to any key, with more than one shortcut where useful. TapeVision warns when a key is already assigned. Hold Alt to apply a chart shortcut to every chart on screen.
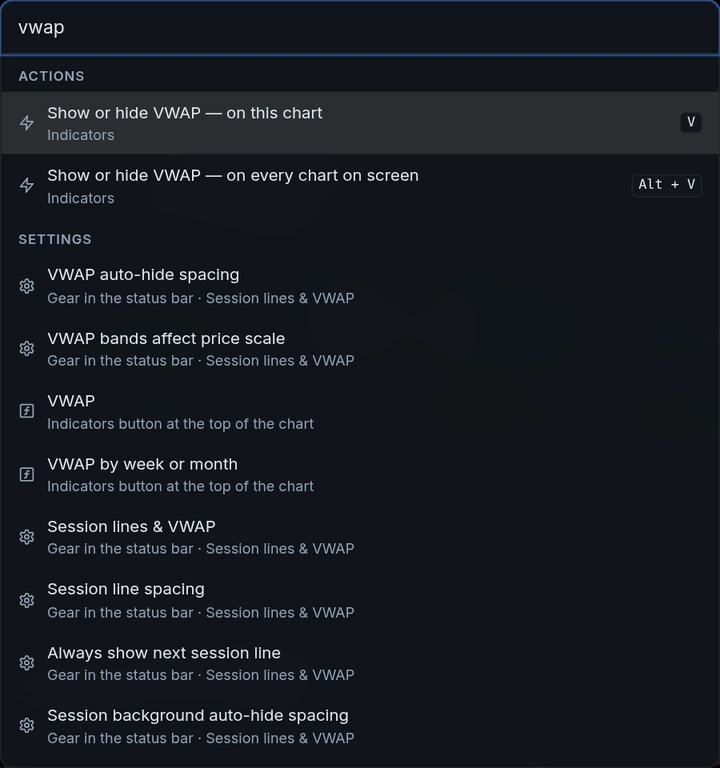
Use Ctrl+K to find pages, chart actions, settings, symbols and manual topics. Search never places an order.
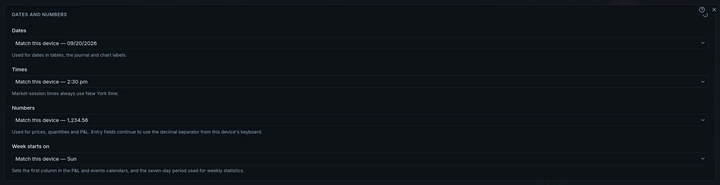
Set date order, 12- or 24-hour time, number separators and the first day of the week. Each follows the computer’s settings until changed.
Everything on this page is in the app from the first start. The built-in paper broker needs no account.